View survey reports
-
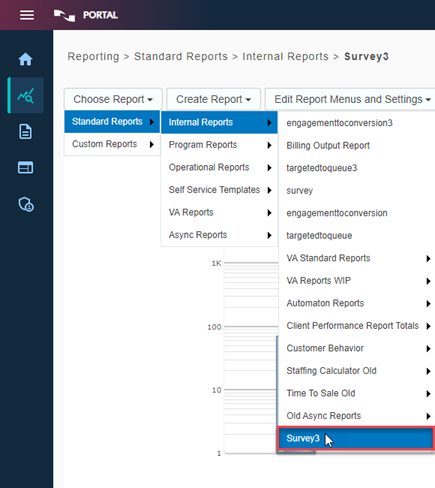
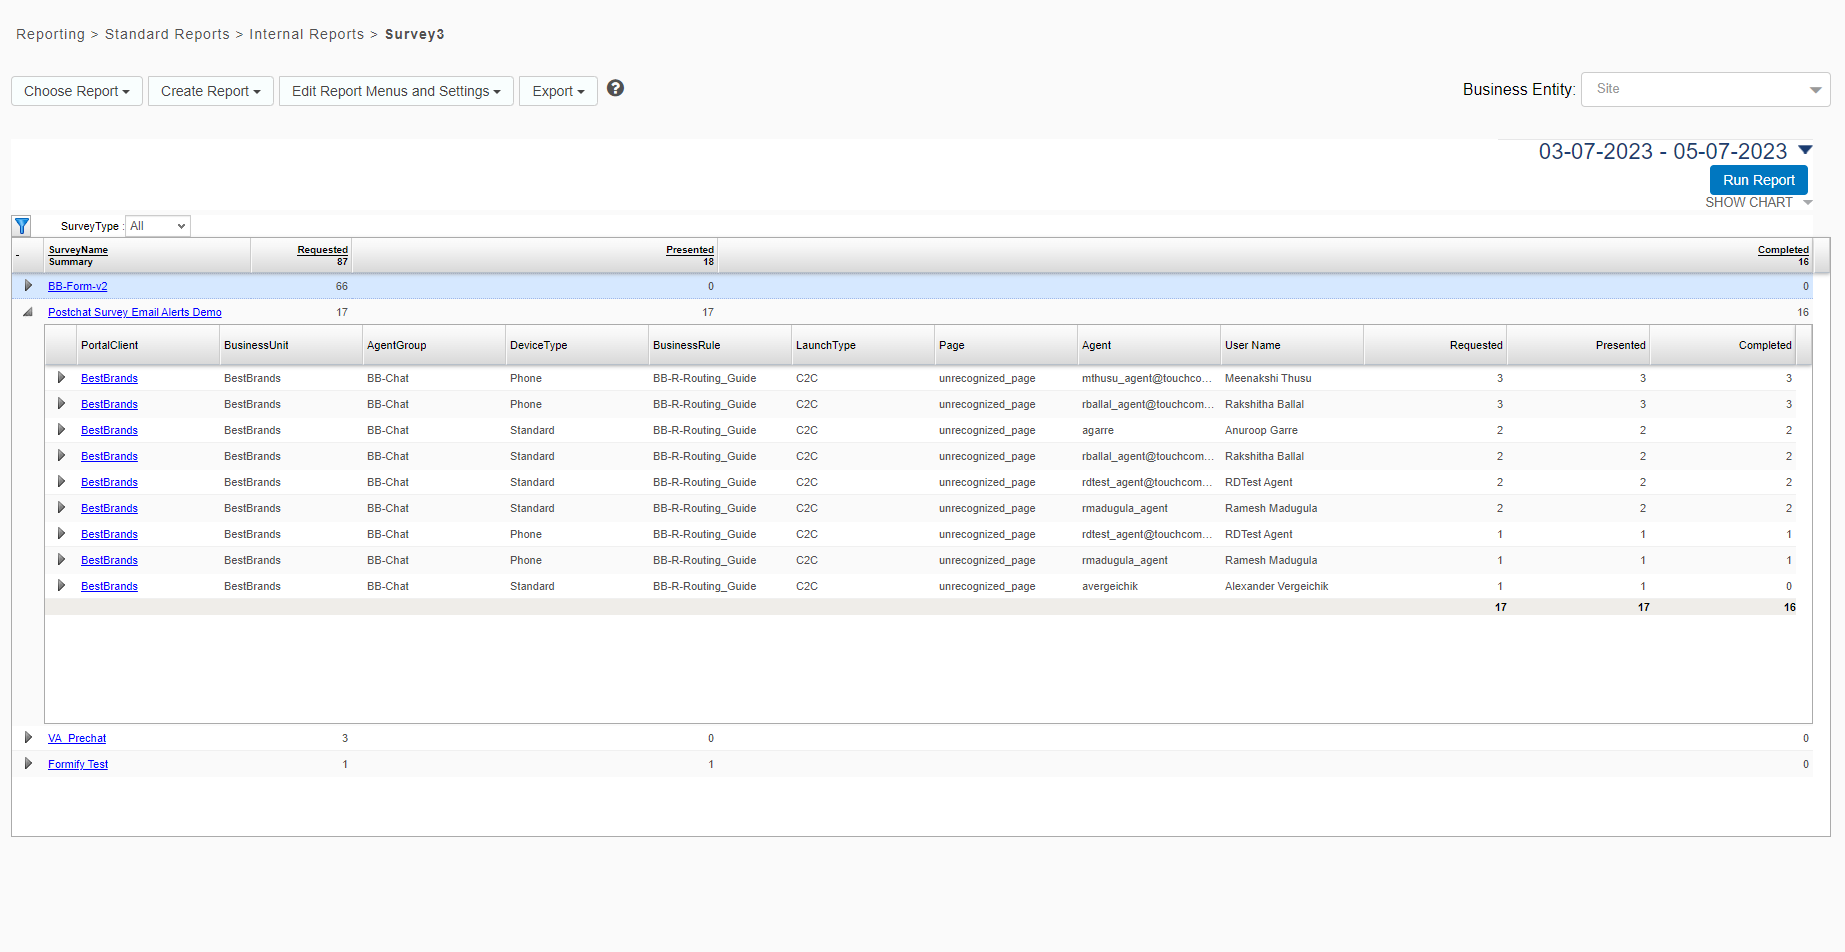
Select Choose Report > Standard Reports > Internal Reports > Survey3.
-
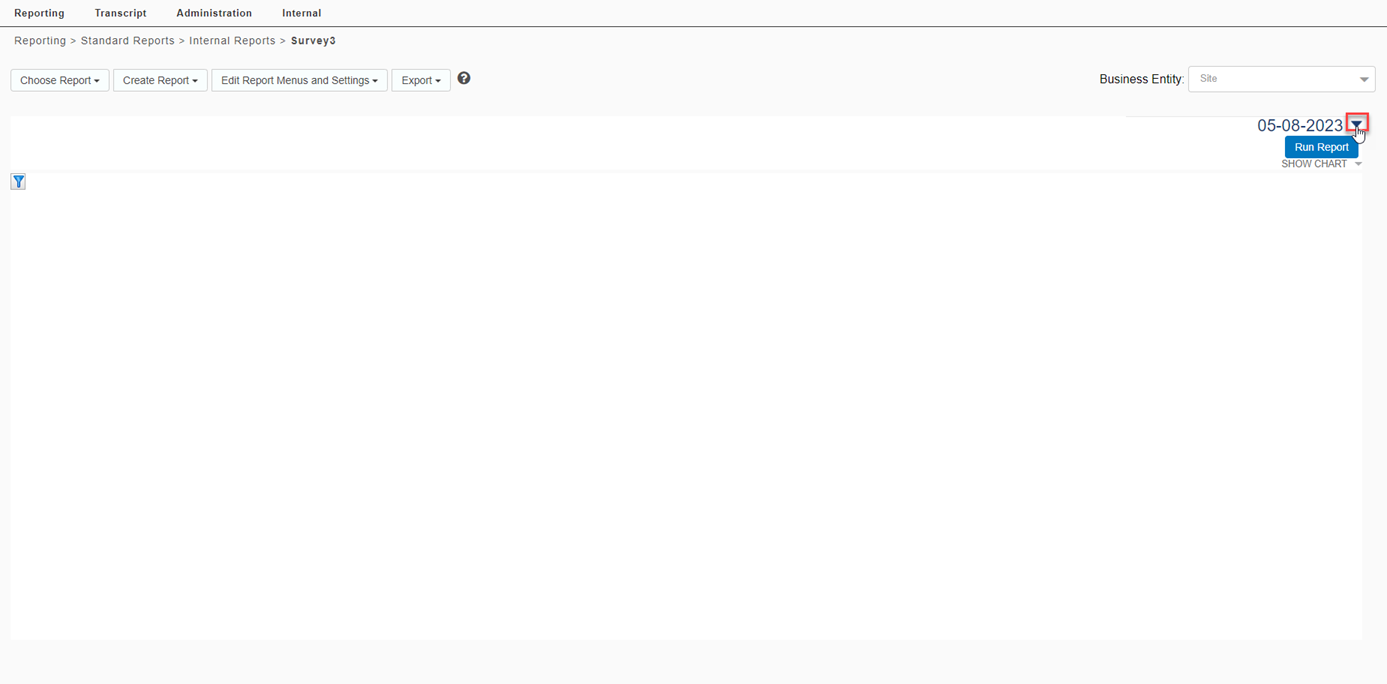
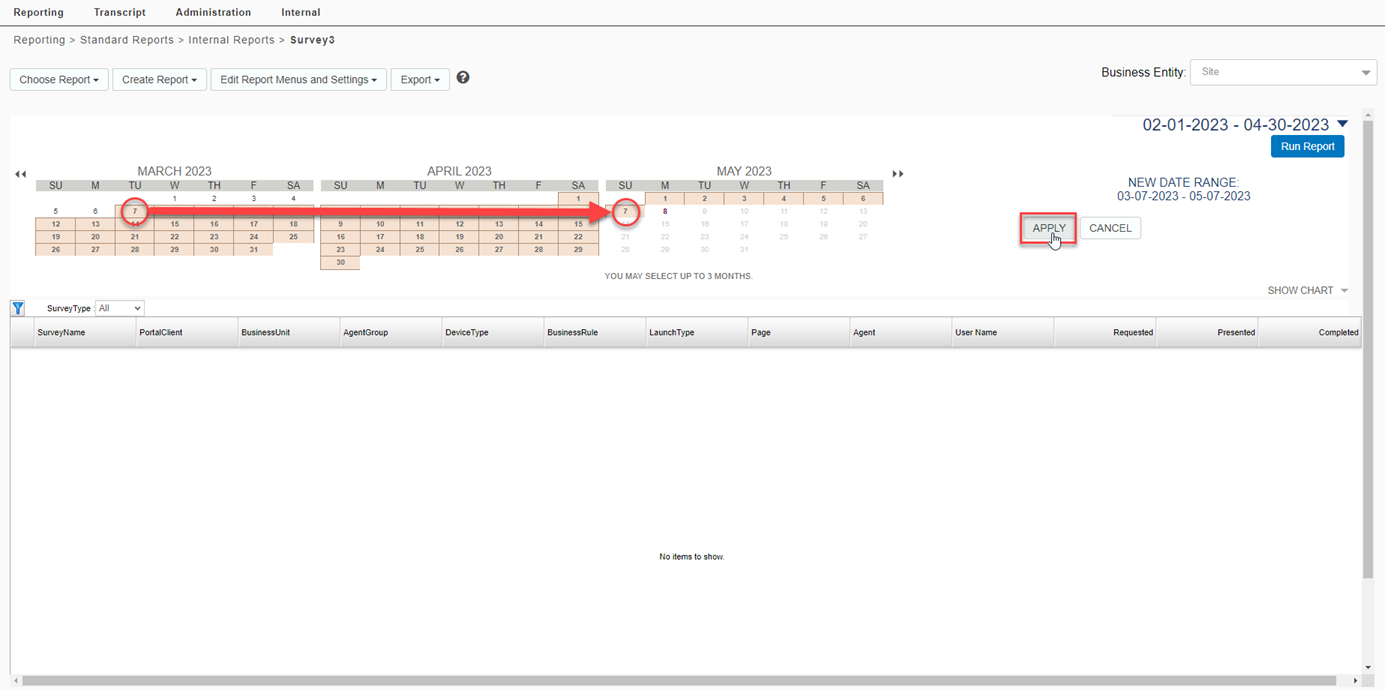
Open the calendar tool, select a date range and click Apply.
-
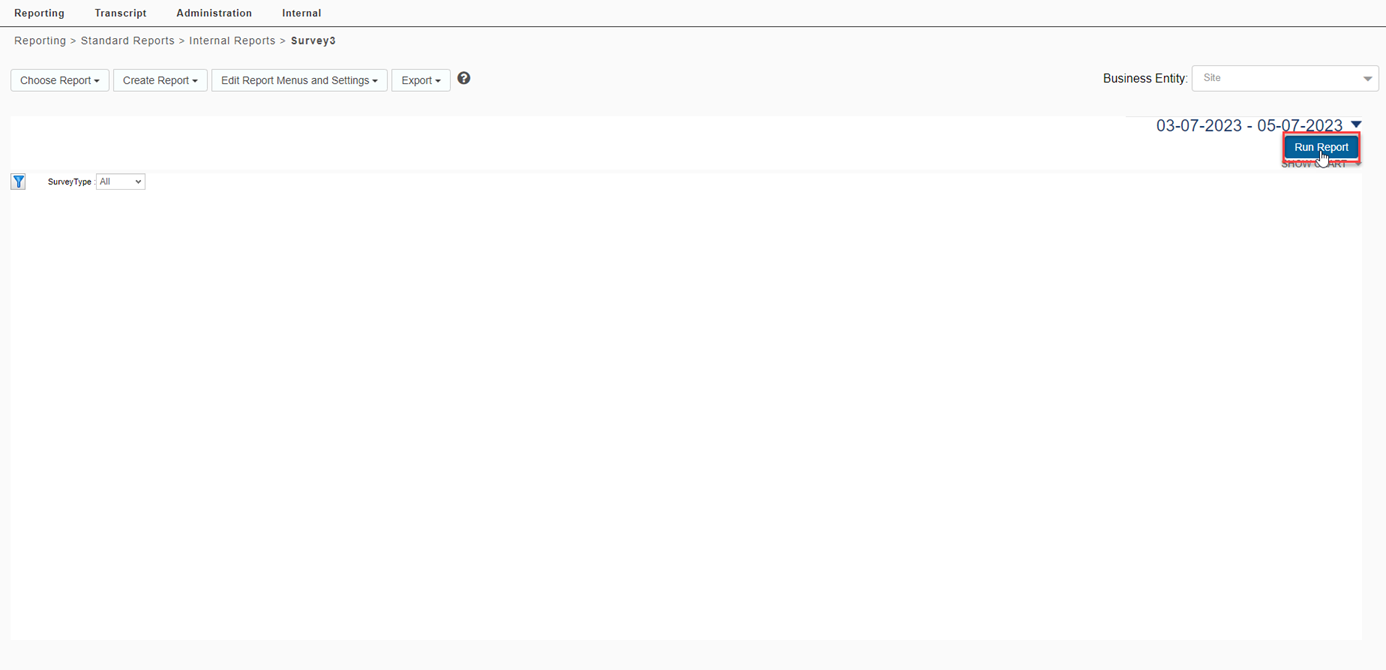
Click Run Report.
-
The survey report will be generated, and list each survey report by name.
The following metrics are displayed:
-
Requested: The number of surveys that were requested. A survey is defined as requested when the customer takes an action that results in the request of a survey. For example, when a customer closes the chat window, a survey is requested.
-
Presented: The number of surveys that were presented to the customer.
-
Completed: The number of surveys that were completed or submitted by the customer.
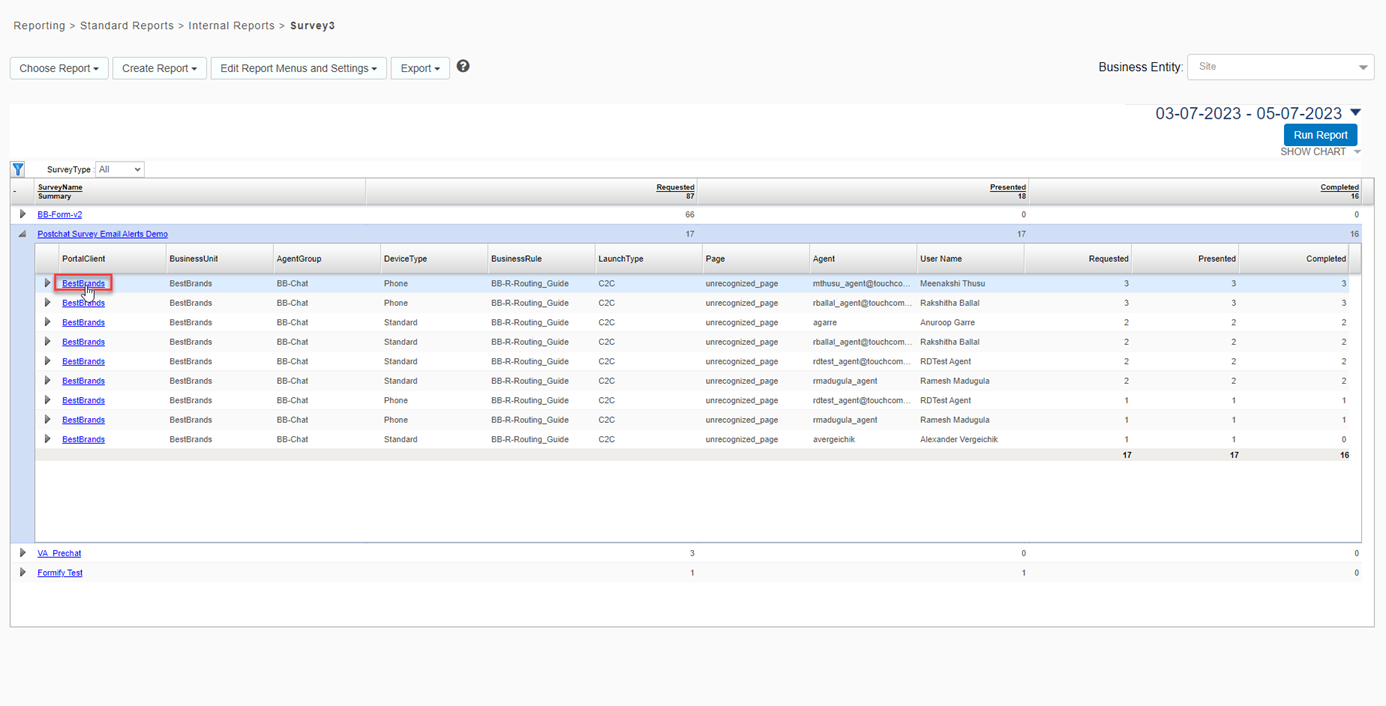
Click on the triangle icon next to a survey name to expand and display the results for the first dimension of the selected report. The table displays dimensions from the selected report. All non-filtered dimensions can be viewed in the table by clicking the triangle on each subsequent level.
-
-
Click on a link for any dimension value to go to the Survey Summary view.
-
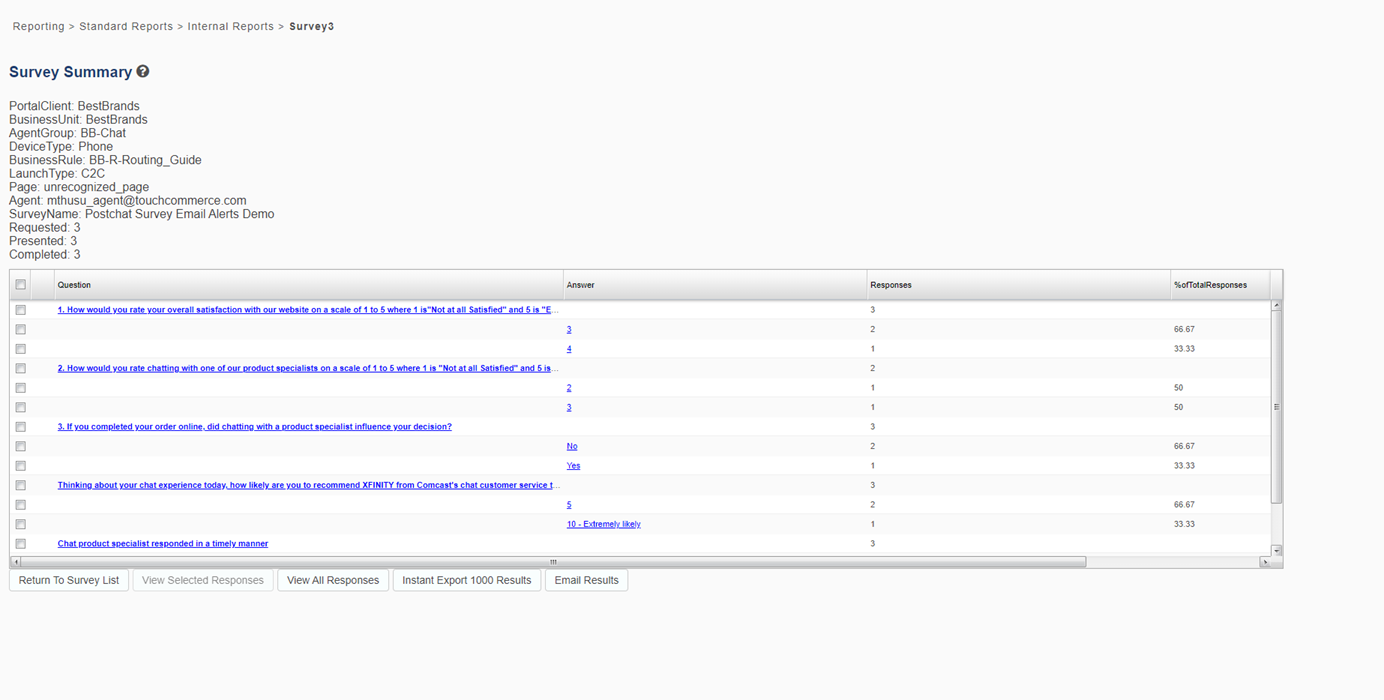
The Survey Summary displays survey questions and answers associated with the dimension values selected in the Survey List view. The summary at the top of the page displays metrics for the dimension values. Click the links in the table to view more details.
-
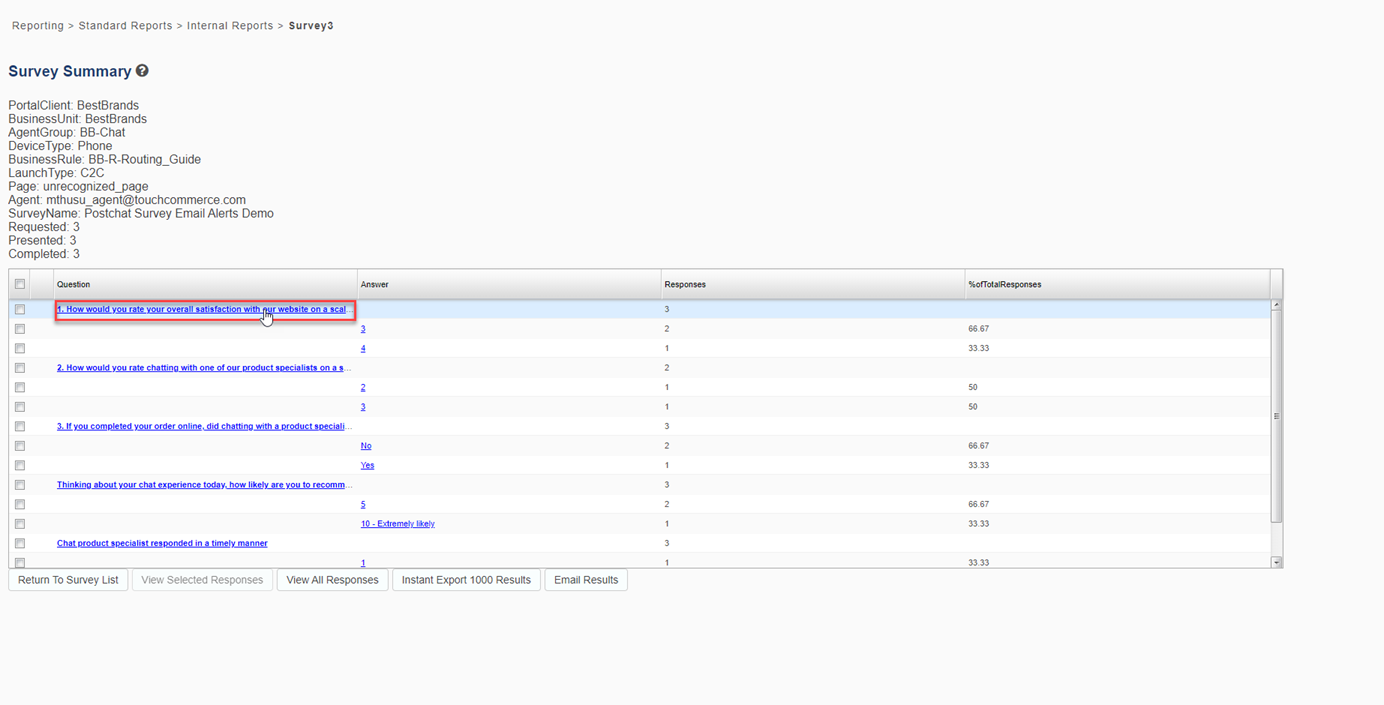
Click on a question link to open the Survey Search Results view.
-
This view displays a list of engagements that had a survey with the selected answer(s). Chat IDs are presented in this table as links that you can click to display the Transcript Details page.
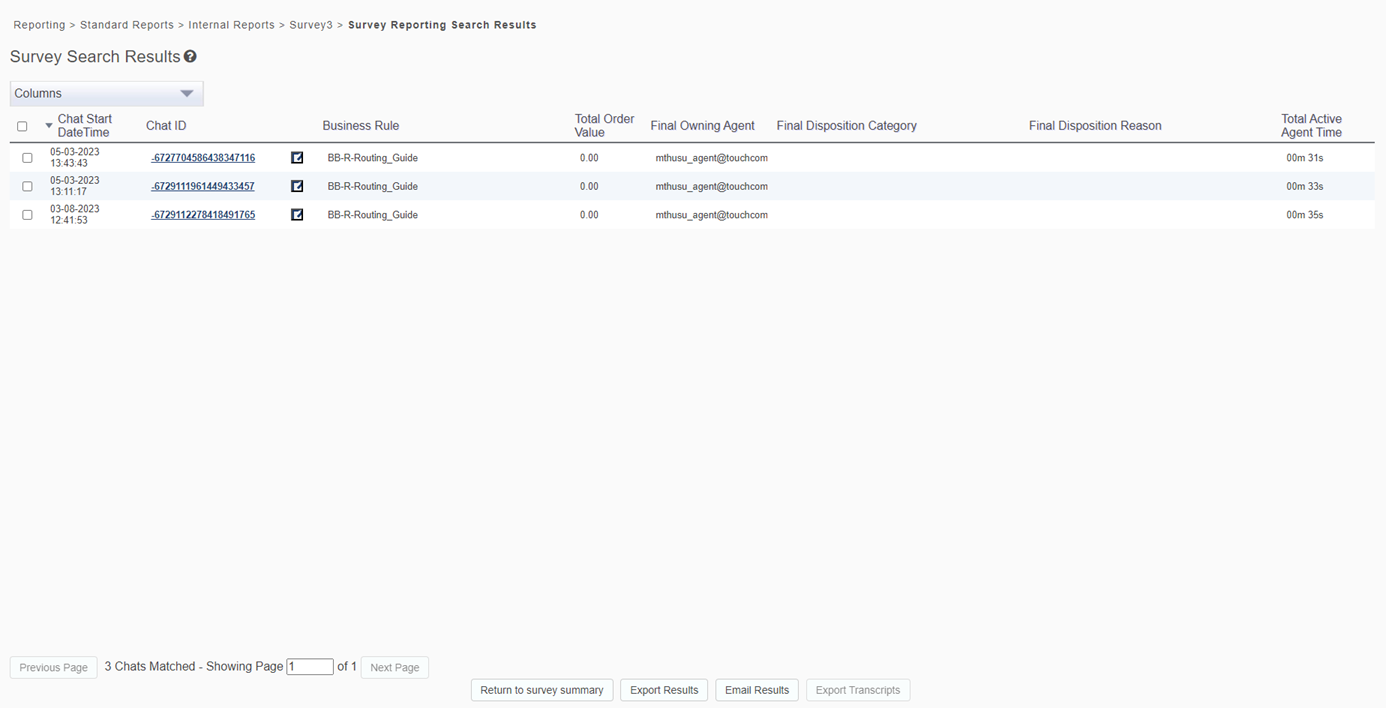
-
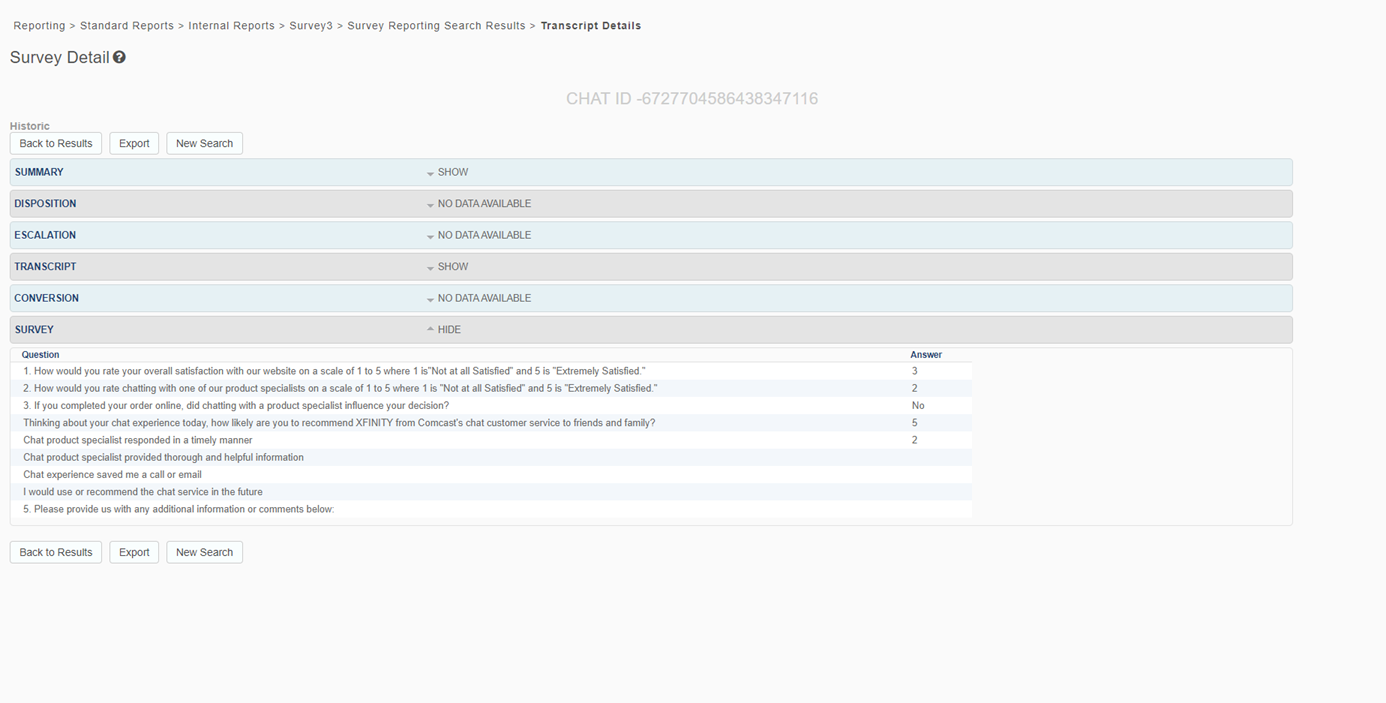
Click a Chat ID to open the Transcript Details view, which displays the survey section, showing both survey questions and answers.
Unexpected survey reporting results
When you include the current day in your report's date range, you may see inconsistent data results between survey views. This can be due to the ongoing processing of data that is changing in real-time. To avoid this result, specify your date range to include the day before the current date. The following are two examples:
-
If a report contains the current day, the Survey Summary view may show different data than the Survey List view or the Survey Search Results view due to ongoing data processing.
-
The table on the Survey List view displays a date range separately for the three displayed metrics (Requested, Presented, and Completed). If a survey was requested on one day and presented on the second day, the Requested and Presented value will be 0, while the Completed value will be 1. This can cause Requested and Presented values to be higher than Completed values when viewing partial day results.
