Data Selector
You can customize the data displayed in the data panel by using the Data Selector, which is located at the top of the left Navigation menu. This feature allows you to display only the data you care about and hide the rest.

You can choose to view aggregated data from one or more business units (BUs) or one or more agent groups (AGs). In addition, you can set the panel to periodically rotate between the BUs or AGs that you select.

As a supervisor, you can choose the business units and agent groups you want to display in Supervisor Desktop. It's important to understand what they represent. Keep the following in mind:
-
A business unit is a line of business for the client, such as a product or service the client offers. BUs are defined according to the client's requirements and configured into the client's custom view. Each supervisor account is assigned one or more BUs, which appear in the Data Selector. When they select a BU, data from agents assigned to the BU is captured and presented in the data panel.
-
An agent group is a group of agents that are treated as a unit for routing purposes. AGs are defined according to the client's requirements and configured into the client's custom view. Typically, one BU is assigned several AGs, based on location or other criteria. Each supervisor account is assigned one or more AGs to supervise, and these appear in the Data Selector for their account. When they select an AG, data from agents in the AG is captured and presented in the data panel.
Viewing data for one or more business units
-
Click the hamburger button (
 ) in the top left corner of the desktop. This displays the Data Selector.
 -
Select Business Unit.
-
If you are assigned to multiple business units, you may select one or more business units from the list.
-
The data tabs now display data for the selected business units only.
Note: If you are assigned to only one business unit, no additional selection is necessary.

Viewing data for one or more agent groups
-
Click the hamburger button (
) in the top left corner of the desktop. This displays the Data Selector. -
Select Agent Group.
-
If you are assigned to multiple agent groups, you may select one or more agent groups from the list.
-
The data tabs now display data for the selected agent groups only.
Note: If you are assigned to only one agent group unit, no additional selection is necessary.

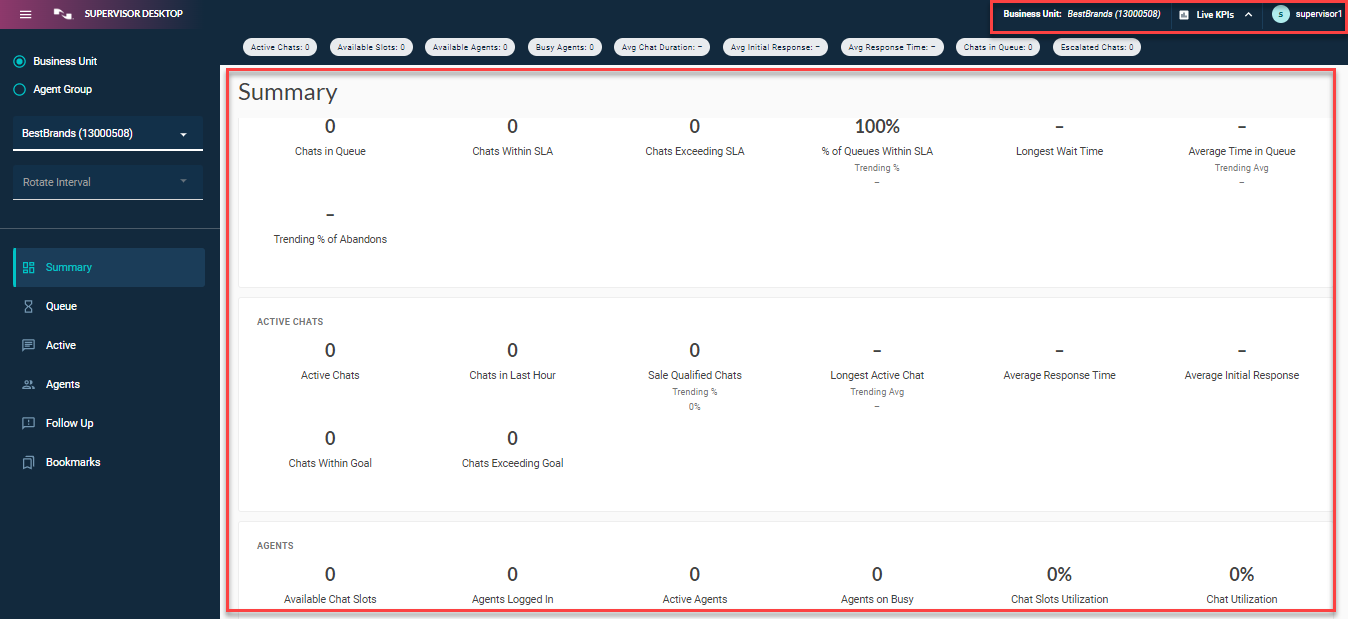
In the above image, Agent Group is selected and the panel displays the available agent groups. Because BB-Call has been selected, the data tabs display data for that agent group only.
The currently selected Business Unit or Agent Group in the Navigation menu is displayed in the header bar for easy reference.
When multiple AGs or BUs are selected, the header bar will display the number selected, as shown here. Also, you can hover over the header to display the names of the selected BUs or AGs.
In this example, 2 AGs are selected.

Any AG or BU selections you make prior to logging out are saved and will be in effect in your next session.
Note: User settings are saved only if the user does not clear the browser cache.
Overview of the Data Rotator
You can select any combination of either agent groups or business units and by default the data will be displayed in aggregate on the Summary tab and all other data tabs. However, you can choose to display data for individual BUs or AGs one at a time by using the Data Rotator. The Data Rotator is a feature that displays data for an individual BU or AG for a short period, then displays another, and so on, until it cycles through the list of selected groups or units. This gives you easy visibility into the performance of each BU or AG. This can be convenient if you supervise multiple groups or units.
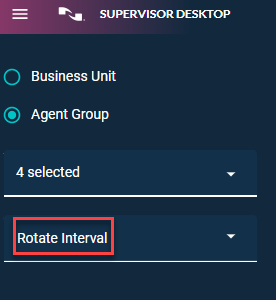
To enable the Data Rotator, select a value from the Rotate Interval drop-down menu. The rotate interval is the period of time (in seconds) that each BU or AG should be displayed. The minimum is 5 and the maximum is 60 seconds.

When rotation is enabled, the header displays the current BU or AG name as it cycles through the selections. In the following example, there are 4 agent groups selected and the data for BB-Call is currently being displayed.

The rotation interval is set to 5 seconds, meaning that each agent group is displayed for 5 seconds.
Using the Data Rotator
-
Click the hamburger button (
) in the top left corner of the desktop. This displays the Data Selector. -
Select the category you want to monitor: either Agent Group or Business Unit.
-
Select check boxes for the specific AGs or BUs you want to rotate through. Here's an example with three AGs selected:

-
Click the Rotate Interval button to display drop-down menu.
-
Set the rotate interval you want to use. The minimum is 5 and maximum is 60 seconds.

Here's an example showing 4 AGs selected and a rotation interval of 15 seconds:
-
While the Data Rotator is enabled, a set of navigation buttons appears in the header. Use the navigation buttons to pause or resume rotation, or move to the previous or next selection as needed. For example, if you want to take a closer look at one agent group, click Pause to temporarily stop rotation and click Resume to resume rotation. There is no need to de-select any groups or units.

-
If you select or clear any BUs or AGs while rotation is enabled, then those units are immediately added to or removed from the rotation.
-
To turn off rotation, select No rotation. This stops rotation and causes the navigation buttons to disappear.

