Drilling down to a detailed report
Dashboards present several visualizations on a single page. This is advantageous to those wanting to see high-level information at a glance without needing to go to more than one place. However, because of the space constraints of any one page, each dashboard visualization is smaller with less data granularity than dedicated detailed reports.
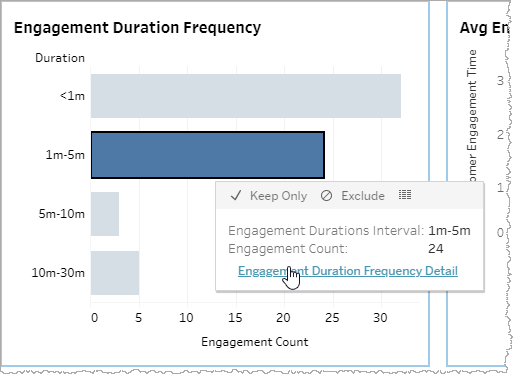
Note: The visualization shown, below, is an example and may not be from the same dashboard you are currently viewing.
If you are on a dashboard and would like to drill down in a visualization to see a larger representation of it with more granularity in both graphical and tabular form, perform the following steps:
-
On your dashboard, in the visualization you would like to drill down from, click one of the data points and mouse over the tool tip.
-
Click the link in the tool tip.
Note: The drill-down link does not appear in the tool tip unless you have first selected one or more data points in the visualization.
The relevant detailed report appears.
