Dialog Details
The Dialog Details report displays dialog-related metrics that underlie the visualizations in the Dialog Dashboard. The intended users of this dashboard are business sponsors and business owners.
Table
Use the filters and sliders to display the desired data in the table. Mouse over any cell in the table for a tooltip with relevant information.
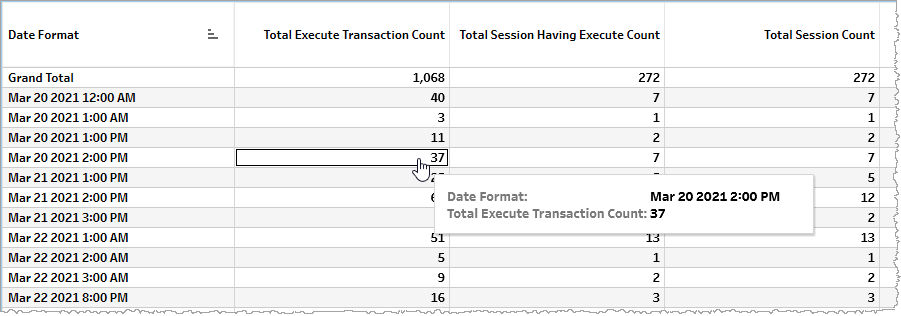
The table displays metrics either as raw counts (for example, number of client errors), time duration (for example, client error duration), or calculated metrics. The following are field translations of these metrics.
| Name | Description | Field translation (formula or backend name) |
|---|---|---|
| Total Execute Transaction Count | Total number of execution transactions. |
Metric: |
| Total Session Having Execute Count | Total number of sessions with executions. |
Metric: |
| Total Session Count |
Total number of sessions. |
Metric: |
| Client Error Duration (Seconds) |
Aggregate duration of time of all sessions having client errors within the specified time period (one row of the table spanning a time period whose length is defined by the Date Granularity slider). |
Metric: |
| Server Error Duration (Seconds) |
Aggregate duration of time of all sessions having server errors within the specified time period (one row of the table spanning a time period whose length is defined by the Date Granularity slider). |
Metric: |
| Total Session Duration (Seconds) |
Aggregate duration of time of all sessions. |
Metric: |
| Successful Session Duration (Seconds) |
Aggregate duration of time of all sessions having no errors within the specified time period (one row of the table spanning a time period whose length is defined by the Date Granularity slider). |
Metric: |
| Successful Session Count |
Number of sessions having no errors within the specified time period (one row of the table spanning a time period whose length is defined by the Date Granularity slider). |
Metric: |
| Client Error |
Proportion of all errors that are client errors. Note: This is a percent value with 1.0 signifying 100%. |
Calculated metric: (Formula: (C / (A + B + C)) * 100)
|
| Server Error |
Proportion of all errors that are server errors. Note: This is a percent value with 1.0 signifying 100%. |
Calculated metric: (Formula: (B / (A + B + C)) * 100)
|
Filtering
The filters in this section allow you to reduce the volume of displayed data on the report.
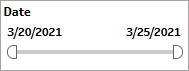
Date
The Date filter is a slider with two moveable sides. By narrowing the date range, you display only data falling within the range.
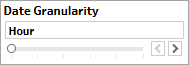
Date Granularity
The Date Granularity filter allows you to adjust the reported data granularity described by the trend lines. Drag the slider horizontally to adjust the granularity of reported data. Alternatively, you can use the left  and right
  arrow buttons to move the slider incrementally.
Appid
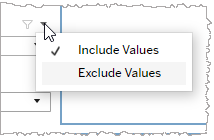
This filter selectively reduces the volume of data displayed based on application ID. The filter reduces data by including or excluding one or several applications. Specify one or more applications from the list as required.
Click Include values to display only those data possessing the selected values. All other data are hidden from the visualization.
Click Exclude values to display only those data that do not possess the selected values.