NLU Details
The NLU Details report displays natural language understanding![]() Speech recognition techniques that permit a user to answer a prompt with a full phrase or sentence, as in everyday conversation. Typically, natural speech is longer in duration and has a broad range of possible meanings. A grammar (or model) capable of natural language understanding must accept a wide variety of different phrases.-related metrics that underlie the visualizations in the NLU Dashboard. The intended users of this report are business sponsors and business owners.
Speech recognition techniques that permit a user to answer a prompt with a full phrase or sentence, as in everyday conversation. Typically, natural speech is longer in duration and has a broad range of possible meanings. A grammar (or model) capable of natural language understanding must accept a wide variety of different phrases.-related metrics that underlie the visualizations in the NLU Dashboard. The intended users of this report are business sponsors and business owners.
Table
Use the filters and sliders to display the desired data in the table. Mouse over any cell in the table for a tooltip with relevant information.
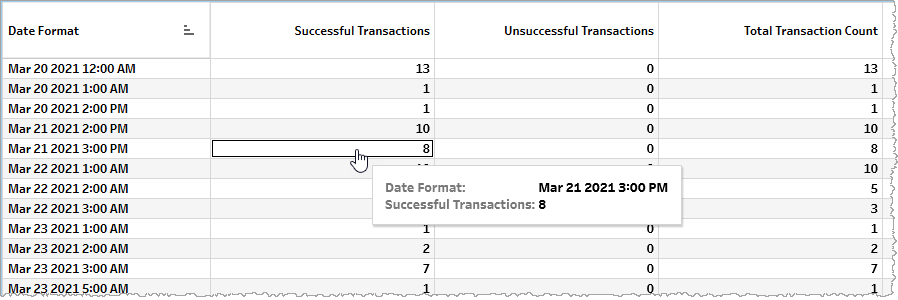
The table displays metrics either as raw counts (for example, Total Transaction Count) or calculated metrics (for example, Avg. Total Transaction Duration (Seconds)).
| Name | Description |
|---|---|
| Successful Transactions |
Total number of successful NLU transactions, each beginning with a transaction request at an API endpoint of the NLE Hosted Service and ending with a response message having a status of complete. |
| Unsuccessful Transactions |
Total number of failed NLU transactions, each beginning with a transaction request at an API endpoint of the NLE Hosted Service and ending with a response message having a status of failed. |
| Total Transaction Count |
Total number of NLU transaction requests regardless of success or failure |
| Client Error |
Number of client errors |
| Unauthorized Voice Used |
Number of unauthorized voices used |
| Server Error |
Number of server errors |
| Avg. Total Transaction Duration (Seconds) |
Average duration in seconds for all NLU transactions (irrespective of whether they are successful or unsuccessful) |
| Avg. Successful Transaction Duration (Seconds) |
Average duration in seconds for successful NLU transactions |
| Avg. Client Error Duration (Seconds) |
Average duration in seconds for a client error |
| Avg. Unauthorized Voice Used Duration (Seconds) |
Average duration in seconds of unauthorized voice use |
| Avg. Server Error Duration (Seconds) |
Average duration in seconds for a server error |
| Average Latency (Seconds) |
Average latency in seconds |
Filtering
The filters in this section allow you to reduce the volume of displayed data on the report.
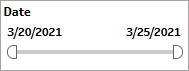
Date
The Date filter is a slider with two moveable sides. By narrowing the date range, you display only data falling within the range.
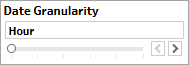
Date Granularity
The Date Granularity filter allows you to adjust the reported data granularity described by the trend lines. Drag the slider horizontally to adjust the granularity of reported data. Alternatively, you can use the left  and right
  arrow buttons to move the slider incrementally.
Appid
This filter selectively reduces the volume of data displayed based on application ID. The filter reduces data by including or excluding one or several applications. Specify one or more applications from the list as required.
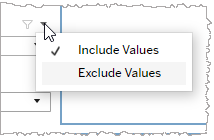
Click Include values to display only those data possessing the selected values. All other data are hidden from the visualization.
Click Exclude values to display only those data that do not possess the selected values.
Language
This filter selectively reduces the volume of data displayed based on language. The filter reduces data by including or excluding one or several languages.
Specify one or more languages from the list as required.
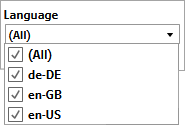
Click Include values to display only those data possessing the selected values. All other data are hidden from the visualization.
Click Exclude values to display only those data that do not possess the selected values.
Voice
This filter selectively reduces the volume of data displayed based on selected voice. The filter reduces data by including or excluding one or several voices.
Specify one or more voices from the list as required.
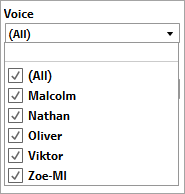
Click Include values to display only those data possessing the selected values. All other data are hidden from the visualization.
Click Exclude values to display only those data that do not possess the selected values.
Org ID
This filter selectively reduces the volume of data displayed based on org ID. The filter reduces data by including or excluding one or several IDs.
Specify one or more org IDs from the list as required.
Click Include values to display only those data possessing the selected values. All other data are hidden from the visualization.
Click Exclude values to display only those data that do not possess the selected values.
