TTS Details
The TTS Details report displays text-to-speech![]() The process of synthesizing audible speech from typed text.-related metrics that underlie the visualizations in the TTS Dashboard. The intended users of this report are business sponsors and business owners.
The process of synthesizing audible speech from typed text.-related metrics that underlie the visualizations in the TTS Dashboard. The intended users of this report are business sponsors and business owners.
Table
Use the filters and sliders to display the desired data in the table. Mouse over any cell in the table for a tooltip with relevant information.
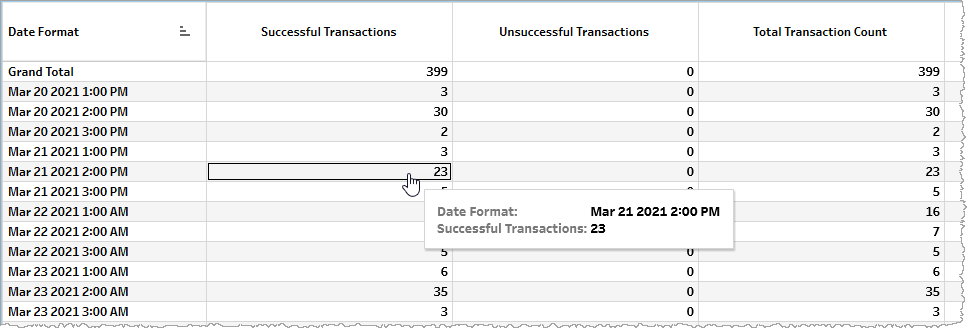
The table displays metrics either as raw counts (for example, Total Transaction Count) or calculated metrics (for example, Avg. Total Transaction Duration (Seconds)).
| Name | Description |
|---|---|
| Successful Transactions |
Total number of successful speech synthesis transactions, each beginning with a transaction request at an API endpoint of the Hosted Service and ending with the successful completion of the request and a resulting transaction result code. |
| Unsuccessful Transactions |
Total number of failed speech synthesis transactions, each beginning with a transaction request at an API endpoint of the Hosted Service but failing to end with the successful completion of the request and a resulting transaction result code. |
| Total Transaction Count |
Total number of speech synthesis transaction requests regardless of success or failure |
| Client Error |
Number of client errors |
| Server Error |
Number of server errors |
| Avg. Total Transaction Duration (Seconds) |
Average duration in seconds for all speech synthesis transactions (irrespective of whether they are successful or unsuccessful) |
| Avg. Successful Transaction Duration (Seconds) |
Average duration in seconds for successful speech synthesis transactions |
| Avg. Client Error Duration (Seconds) |
Average duration in seconds for a client error |
| Avg. Server Error Duration (Seconds) |
Average duration in seconds for a server error |
| Average Latency (Seconds) |
Average latency in seconds |
| Total Character Count | Total number of characters for specified date |
| Avg. Character Count | Average number of characters |
Filtering
The filters in this section allow you to reduce the volume of displayed data on the report.
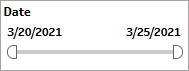
Date
The Date filter is a slider with two moveable sides. By narrowing the date range, you display only data falling within the range.
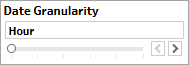
Date Granularity
The Date Granularity filter allows you to adjust the reported data granularity described by the trend lines. Drag the slider horizontally to adjust the granularity of reported data. Alternatively, you can use the left  and right
  arrow buttons to move the slider incrementally.
Appid
This filter selectively reduces the volume of data displayed based on application ID. The filter reduces data by including or excluding one or several applications. Specify one or more applications from the list as required.
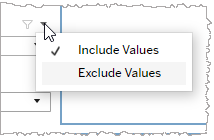
Click Include values to display only those data possessing the selected values. All other data are hidden from the visualization.
Click Exclude values to display only those data that do not possess the selected values.
Language
This filter selectively reduces the volume of data displayed based on language. The filter reduces data by including or excluding one or several languages.
Specify one or more languages from the list as required.
Click Include values to display only those data possessing the selected values. All other data are hidden from the visualization.
Click Exclude values to display only those data that do not possess the selected values.
Voice
This filter selectively reduces the volume of data displayed based on selected voice. The filter reduces data by including or excluding one or several voices.
Specify one or more voices from the list as required.
Click Include values to display only those data possessing the selected values. All other data are hidden from the visualization.
Click Exclude values to display only those data that do not possess the selected values.
Org ID
This filter selectively reduces the volume of data displayed based on org ID. The filter reduces data by including or excluding one or several IDs.
Specify one or more org IDs from the list as required.
Click Include values to display only those data possessing the selected values. All other data are hidden from the visualization.
Click Exclude values to display only those data that do not possess the selected values.
TTS Version
TTS version 3 is a text-to-speech engine powered by Nuance Vocalizer for Cloud version 2 (NVCv2) and Nuance Vocalizer for Enterprise (NVE). It works with Nuance voice packs to synthesize speech from plain text, SSML, or Nuance control codes. TTSv3 events support premium and high-premium voice quality.
TTS version 4 offers text-to-speech services powered by NVCv3 and the Text-to-Speech feature of Microsoft Azure Cognitive Services for Speech. Working with Microsoft neural voices, TTS version 4 synthesizes speech from plain text or SSML input. The gRPC synthesizer protocol provided by TTS version 4 can request synthesis services in any of the programming languages supported by gRPC. TTSv4 events support Neural voice quality which produces lifelike speech with realistic intonation and flow.
Specify one or both (All) TTS versions from the list as required.
Click Include values to display only those data possessing the selected values. All other data are hidden from the visualization.
Click Exclude values to display only those data that do not possess the selected values.
