Metrics Summary
The Metrics Summary report visualizes the number of conversations split out by individual values for each metric and
all metrics and their component metric values and graphically represents the relative distribution of each metric value across all channels.
In addition to the use of report filters, Nuance Insights allows you to manipulate displayed data through several other means in order to better visualize information. Select from the following to learn more:
Visualization
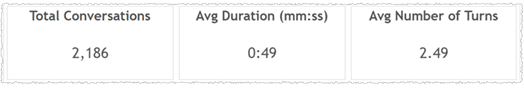
At the top of the report is a widget displaying the total number of conversations, average duration, and average number of turns across all selected channels.
You can view the data for this section either as a bar chart or in a text-only table. Both formats visualize the number of conversations having a given metric value and the proportion that number represents relative to the total number of conversations.
Note: To see the data from the graphical visualization displayed in an alternative, textual way, click Show Table. To toggle back to the graphical view, click Show Graph.
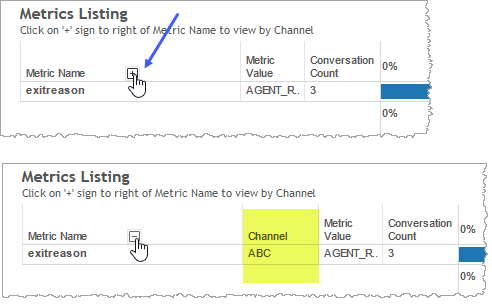
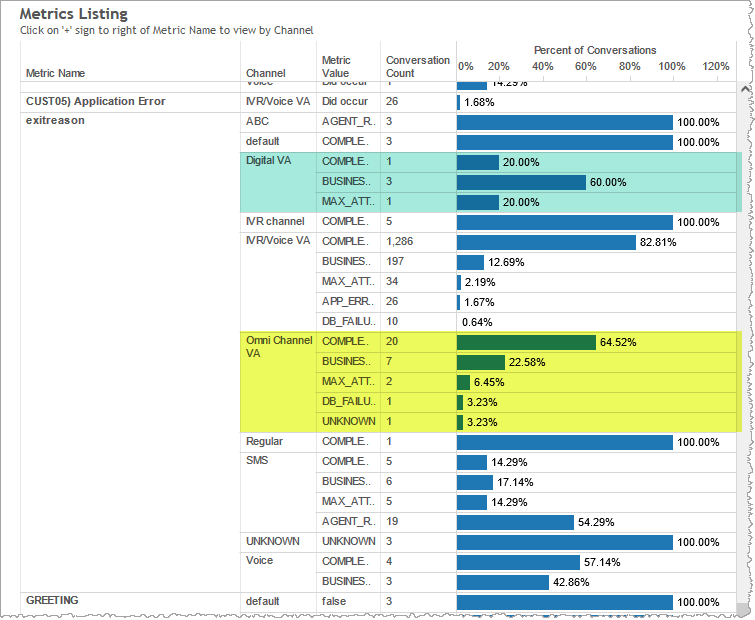
In the graph, the length of any bar signifies the ratio of the number of conversations having a given value for a given metric, compared to the overall number of conversations having any value for the same metric. The table presents this ratio in percent format in the Percent of Total Conversation Count column. In both graph and table formats, you can further differentiate conversations having a given metric by channel. To see the Channel column, click the plus (  ) sign.
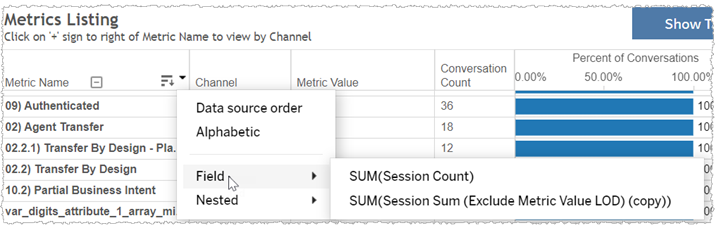
You can sort the Metric Name by using Data source order sort or Alphabetic sort. Sum of Session court or sum of Session sum (Exclude Metric value LOD) (copy) sorting is used to sort across all values of Metric Name or within it.
In the example, below, 9 conversations in the ivr channel (highlighted) had a true metric value of B2) Attempted Recognition. Those conversations comprise 3.81% of all conversations in the ivr channel complying with the page's filter constraints and having any value for the B2) Attempted Recognition metric.
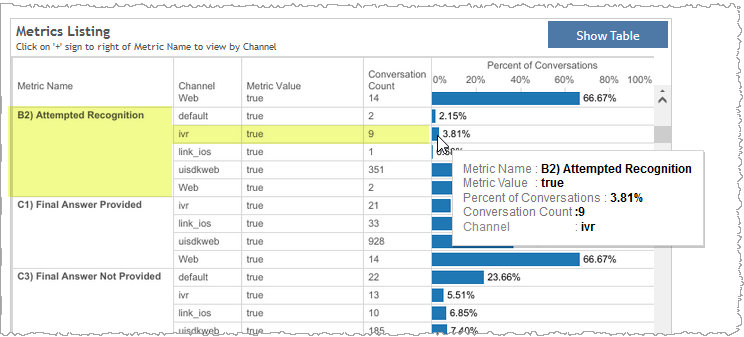
For any given channel having a given metric, the sum of percent distributions among all of that metric's values add up to 100%. In the example, below, all Digital VA channel conversations having an exitreason metric (highlighted in blue) add up to 100%. All Omni Channel VA channel conversations having an exitreason metric (highlighted in yellow) add up to 100%.
Filters
Increase the specificity of your view's reporting by applying filters to the data.
Clicking Include values displays only those data possessing the selected values. All other data are hidden from the visualization.
By contrast, clicking Exclude values displays only those data that do not possess the selected values.

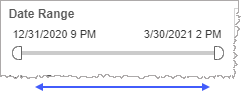
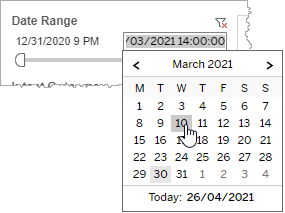
Date Range
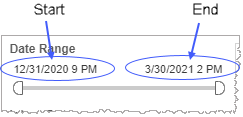
The Date Range filter is a slider with two moveable sides. By narrowing the date range, you display only data falling within the range.
In addition to the slider, the filter allows you to specify start and end points to the range by time of day as well as by date by clicking the Start and End regions, clicking a second time on the time of day, and then manually entering a new time of day.
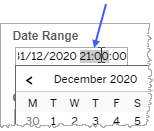
To select a date with the date picker, click the Start region to pick a date from the date picker widget. Do the same with the End region.
Metric Name
By choosing one or more metrics from the list, you refine your data-set by including only those metrics matching the names selected.
- Select all available metrics by selecting All.
- Select only one metric by first clearing the All checkbox, and then selecting the name of the metric whose data you would like to see visualized.
-
Select several metrics (but a subset of all metrics) either by performing one of the following two actions:
- Clear the All checkbox, and then select the names of the metrics whose data you would like to see visualized.
- Select the All checkbox (or ensure it is already selected), and then clear the names of the metrics whose data you would NOT like to see visualized.
Channel (filter)
By choosing one or more channels from the list, you refine your displayed data-set by including data from only those channels matching the selection.
- Select all available values by selecting All.
- Select only one value by first clearing the All checkbox, and then selecting the value whose data you would like to see visualized.
-
Select several values by doing one of the following:
- Clear the All checkbox, and then select the values whose data you would like to see visualized.
- Select the All checkbox and then clear values whose data you would NOT like to see visualized.
Custom filters
This report accommodates customizable filters.
Customizable filters narrow the scope of the reported dataset by including or excluding data with identifiable attributes. These attributes may be about the conversation itself or about an event that may have happened during the conversation.
For more information about how to add customized filters to your view, contact your Nuance Professional Services representative.
Note: If you would like to modify this or any report, Nuance Communications, Inc. recommends you contact Nuance Professional Services.
