Message State
The Message State report describes the volume of message occurrences for each message node, on a per channel basis.
Visualization
For each node, the table lists a raw count and a percentage distribution of the results for each message.
Note: Message nodes use messages that do not require users to respond, whereas Question and Answer nodes can use messages meant to engage the user with questions and then collect answers.
| Element | Metric / Dimension | Description |
|---|---|---|
| Channel | Dimension | Channel the data belongs to. |
| Message Node Name | Dimension | Name assigned to a particular message node. |
| Number of Occurences | Raw metric |
Raw count of how many times a particular message node sent a message. |
| Percent of Occurences | Calculated metric | Proportion a particular message node's raw count represents in comparison to the total sum of all occurrences of all messages for each channel that are displayed in the table. |
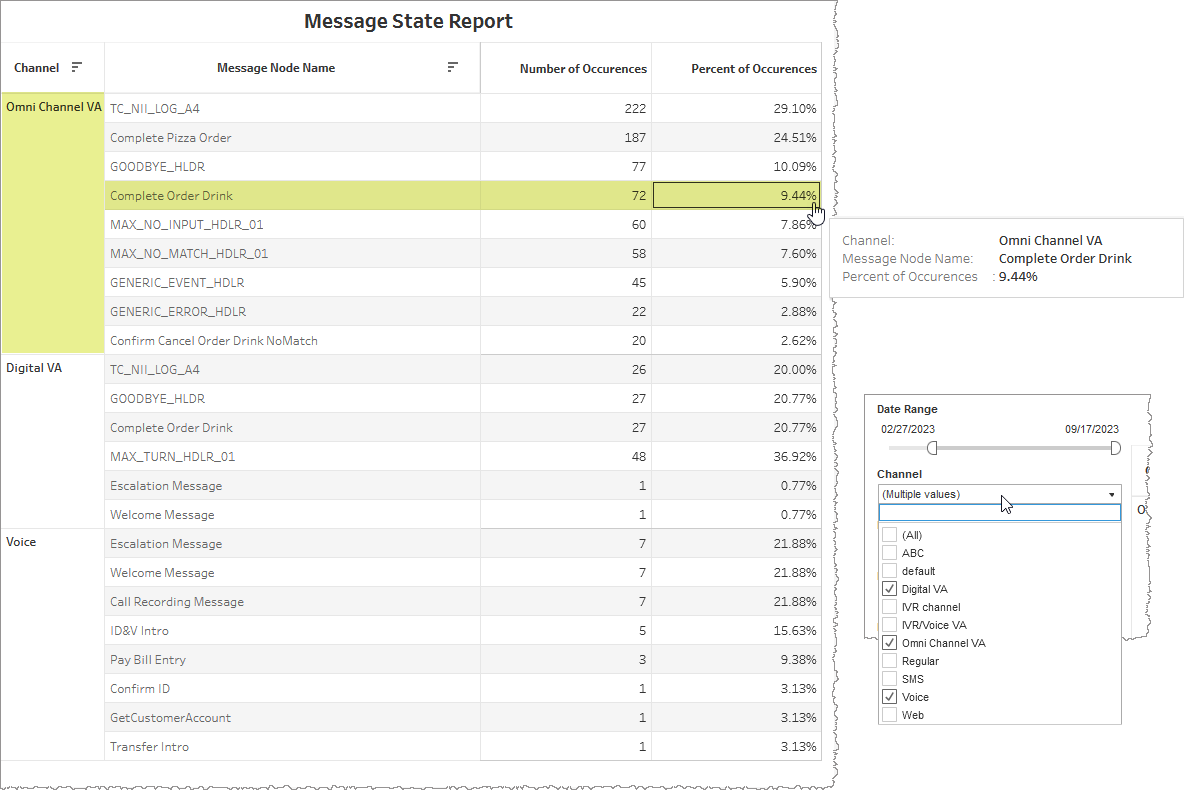
In the example, below, we constrain the table's displayed data to a date range between February 27th, 2023 and September 17th, 2023. We also filter out data not within one of Digital VA, Omni Channel VA, or Voice channels. From this subset pool of data, the table shows there were 72 message occurrences of the Complete Order Drink message node in the Omni Channel VA channel, and this represents 9.44% of the total number of messages among all message nodes within the Omni Channel VA channel currently displayed in the table.
Note: Tooltip information is visible only when mousing over data in the Number of Occurrences and Percent of Occurrencescolumns.
Filters
Increase the specificity of your view's reporting by applying filters to the data.
Clicking Include values displays only those data possessing the selected values. All other data are hidden from the visualization.
By contrast, clicking Exclude values displays only those data that do not possess the selected values.

Date Range
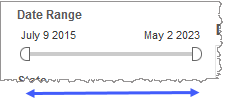
The Date Range filter is a slider with two moveable sides. By narrowing the date range, you display only data falling within the range.
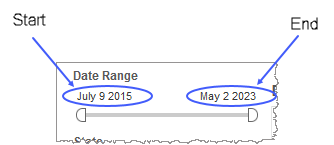
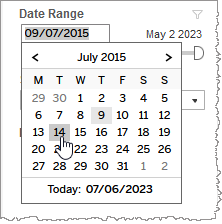
Alternatively, to select start and end dates with the date picker, click the Start region to pick a date from the date picker widget. Do the same with the End region.
Channel
By choosing one or more channels from the list, you refine your displayed data-set by including data from only those channels matching the selection.
- Select all available values by selecting All.
- Select only one value by first clearing the All checkbox, and then selecting the value whose data you would like to see visualized.
-
Select several values by doing one of the following:
- Clear the All checkbox, and then select the values whose data you would like to see visualized.
- Select the All checkbox and then clear values whose data you would NOT like to see visualized.
Custom filters
This report accommodates customizable filters.
Customizable filters narrow the scope of the reported dataset by including or excluding data with identifiable attributes. These attributes may be about the session or about an event that may have happened during the session.
For more information about how to add customized filters to your view, contact your Nuance Professional Services representative.
Note: If you would like to modify this or any report, Nuance Communications, Inc. recommends you contact Nuance Professional Services.
