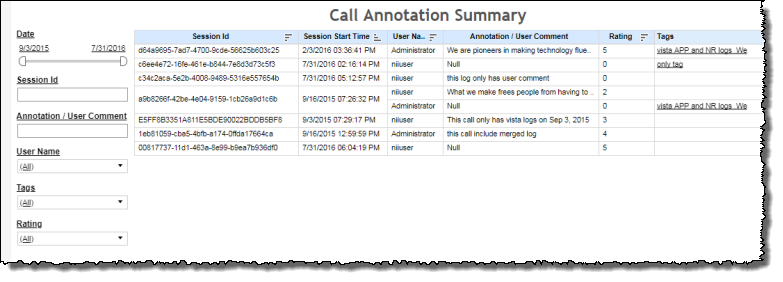
Call Annotation Summary
This report lists, in tabular form, sessions that have been annotated either with text, tag, or rating. In the report, you can filter by one or more of each of these metadata to refine the list with more specificity.
Note: This report is applicable only for clients using the IVR channel.
Visualization
This report is useful for searching for a particular call, for example, with an annotation as a starting point. By filtering for the desired annotation, you can locate the correct session. By taking note of the session ID, you can then enter this ID into Call Viewer to see details on that session.
- You can sort the data in the Call Annotation Summary table, either in ascending or descending alphanumeric order of session ID.
- It should be noted that because this report does not draw upon log files and is instead a reflection of user input, the report will appear blank if the underlying data does not include any annotations.
Filters
Increase the specificity of your dashboard's reporting by applying filters to the data.
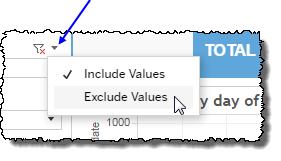
Clicking Include values displays only those data possessing the selected values. All other data are hidden from the visualization.
By contrast, clicking Exclude values displays only those data that do not possess the selected values.
Date
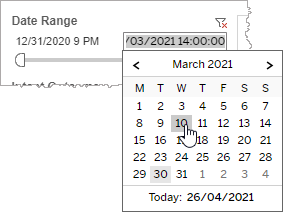
The Date Range filter is a slider with two moveable sides. By narrowing the date range, you display only data falling within the range.
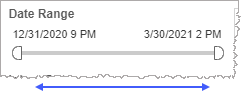
In addition to the slider, the filter allows you to specify start and end points to the range by time of day as well as by date by clicking the Start and End regions, clicking a second time on the time of day, and then manually entering a new time of day.
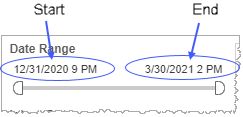
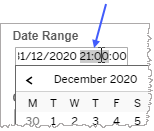
To select a date with the date picker, click the Start region to pick a date from the date picker widget. Do the same with the End region.
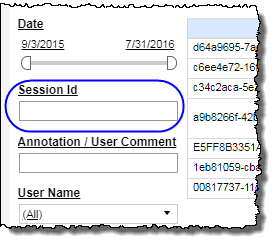
Session ID
-
Specify all or a part of a Session ID either to be included or excluded from the list of call-annotated sessions.
-
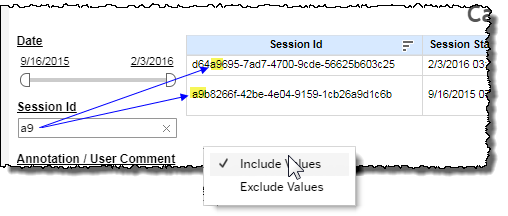
After typing the Session ID string, click the caret icon (
 ), and either include or exclude the selected string, as desired.
Clicking Include values displays only those data possessing the selected values. All other data are hidden from the visualization.
By contrast, clicking Exclude values displays only those data that do not possess the selected values.
Once the Session ID is entered and you've specified if the string is to be included or excluded, the bar graph displays the adjusted list of call-annotated sessions with the specified restrictions.
Annotation/User Comment
-
To reduce the listed number of sessions in the session list, type the some or all of an annotation string belonging to sessions you would like to be included in the list, and then click the (
 ) icon.
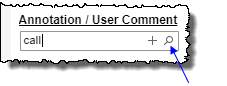
All the annotations with matches to your entry appear as clickable selections.
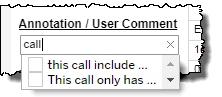
- Select the desired annotation checkbox.
-
If you would like to add a filter for another annotation, click the (
 ) icon, and then redo step 1.
Note: The existence of several Annotation filters is read by the report as logical AND operators.
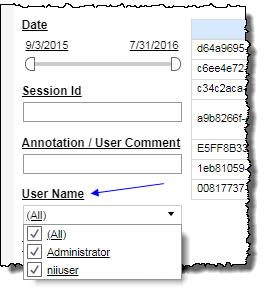
User Name
By choosing one or more user names from the list, you refine your data-set by discriminately including or excluding only those user names matching the names selected.
- Select all available user names by selecting All.
- Select only one user name by first clearing the All checkbox, and then selecting the user name whose data you would like to see visualized.
-
Select several user names (but a subset of all user names ) either by performing one of the following two actions:
- Clear the All checkbox, and then select the user names whose data you would like to see visualized.
- Select the All checkbox (or ensure it is already selected), and then clear the user names whose data you would NOT like to see visualized.
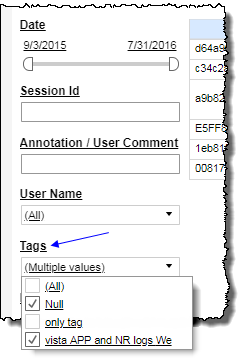
Tags
By choosing one or more tags from the list, you refine your data-set by including only those tags matching the names selected.
- Select all available tags by selecting All.
- Select only one tag by first clearing the All checkbox, and then selecting the tag whose data you would like to see visualized.
-
Select several tags (but a subset of all tags) either by performing one of the following two actions:
- Clear the All checkbox, and then select the tags whose data you would like to see visualized.
- Select the All checkbox (or ensure it is already selected), and then clear the tags whose data you would NOT like to see visualized.
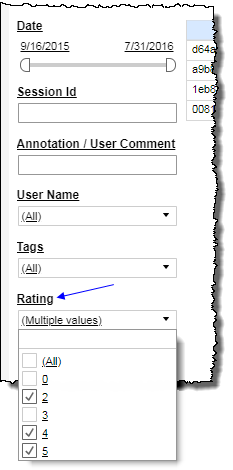
Rating
By choosing one or more ratings from the list, you discriminately refine the visualization of your data-set by including or excluding only those ratings matching the names selected.
- Select all available ratings by selecting All.
- Select only one rating by first clearing the All checkbox, and then selecting the rating whose data you would like to see visualized.
-
Select several ratings (but a subset of all ratings ) either by performing one of the following two actions:
- Clear the All checkbox, and then select the ratings whose data you would like to see visualized.
- Select the All checkbox (or ensure it is already selected), and then clear the ratings whose data you would NOT like to see visualized.
Note: If you would like to modify this or any report, Nuance Communications, Inc. recommends you contact Nuance Professional Services.
