Decision Summary
The Decision State Outcomes bar chart depicts the raw count of decision state outcomes. With the use of the Decision filter, you can specify a subset of decision states for which you would like to see results. You can further narrow your data-set by adjusting the Date filter accordingly.
Note: This report is applicable only for clients using the IVR channel.
Nodes are the units of a speech application that perform a simple operation. Call flow charts map how nodes are connected to one another. Decision nodes are nodes tasked specifically with determining what the next node in the call flow will be. A Decision state is another name for Decision node.
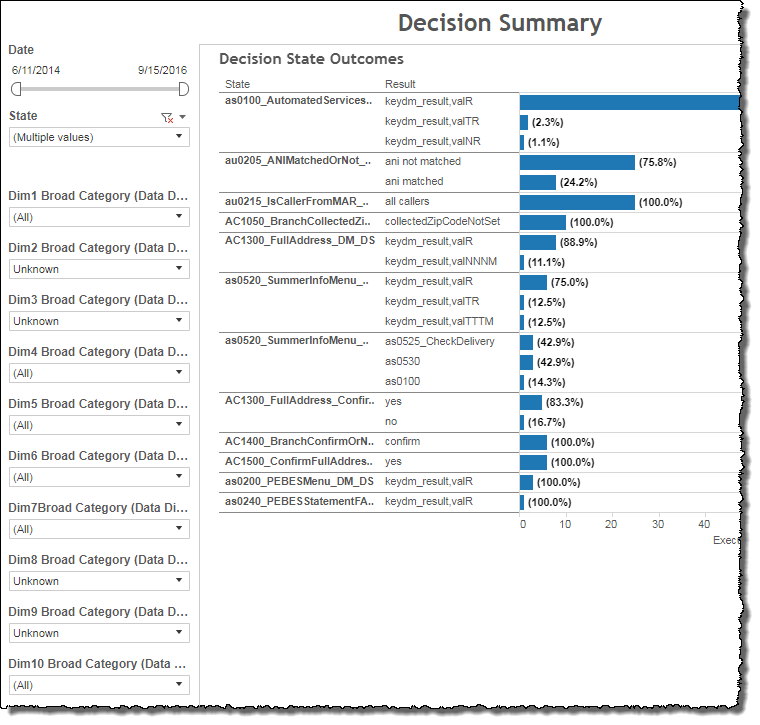
Visualization
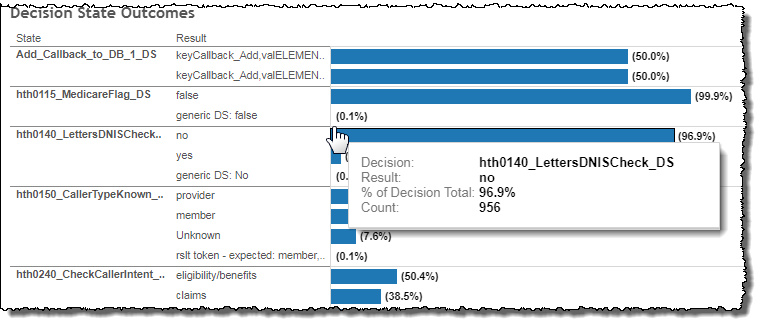
After setting your filters and selecting decision states to be visible, the bar graph visually compares the raw count of results to one another for each applicable decision state. Mousing over any one bar in the graph produces a tool tip with the selected decision state name, selected result, proportion that this result represents compared to all results in this decision (in percent), as well as the overall number of calls.
Filters
Increase the specificity of your dashboard's reporting by applying filters to the data. The Decision Summary's filters include Date and Decision. Additionally, the report may include one or more other customized filters depending on what has been configured specifically for your system.
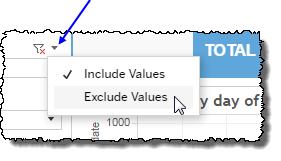
Clicking Include values displays only those data possessing the selected values. All other data are hidden from the visualization.
By contrast, clicking Exclude values displays only those data that do not possess the selected values.
Date
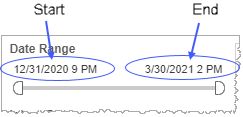
The Date Range filter is a slider with two moveable sides. By narrowing the date range, you display only data falling within the range.
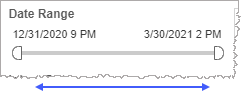
In addition to the slider, the filter allows you to specify start and end points to the range by time of day as well as by date by clicking the Start and End regions, clicking a second time on the time of day, and then manually entering a new time of day.
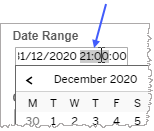
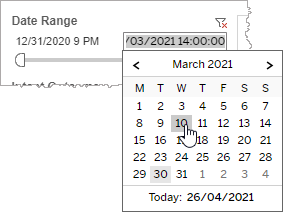
To select a date with the date picker, click the Start region to pick a date from the date picker widget. Do the same with the End region.
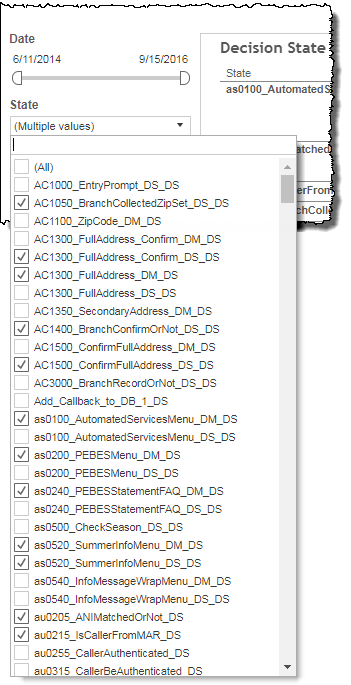
State
By choosing one or more decision states from the list, you refine your data-set by including only those decisions matching the names selected.
- Select all available decision states by selecting All.
- Select only one decision state by first clearing the All checkbox, and then selecting the name of the decision whose data you would like to see visualized.
-
Select several decision states (but a subset of all decisions) by performing one of the following two actions:
- Clear the All checkbox, and then select the names of the decisions whose data you would like to see visualized.
- Select the All checkbox (or ensure it is already selected), and then clear the names of the decisions whose data you would NOT like to see visualized.
Custom filters
This report accommodates customizable filters.
Customizable filters narrow the scope of the reported dataset by including or excluding data with identifiable attributes. These attributes may be about the caller, the call itself, or about an event that may have happened during the call.
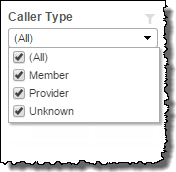
For example, one possible customizable filter you can add and customize in this view is Caller Type, in which you can narrow the reported data to include, or exclude, only those data with the selected caller type.
For more information about how to add customized filters to your view, contact your Nuance Professional Services representative.
Note: If you would like to modify this or any report, Nuance Communications, Inc. recommends you contact Nuance Professional Services.
