DM Options Trends
The DM Options Trends report visualizes changes in dialog module option data over time.
This report includes two visualizations:
- The Option Trends trending graph visualizes options selected over time.
- The Option Trends, Speech vs. DTMF graph visualizes the percentage of options selected via speech vs. DTMF.
Visualizations
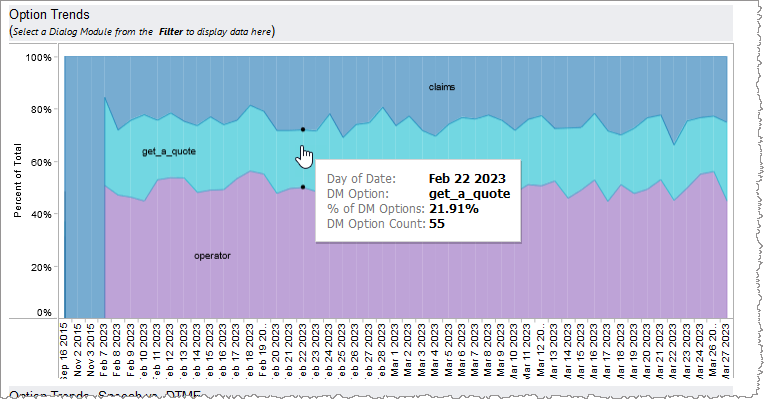
Option Trends
The Option Trends graph trends the percentage of Dialog Module visits that resulted in each option. This is determined by dividing the number of visits that resulted in a given option by the total number of visits. In the Option Trends graph, selected options are trended over time. By default this graph shows all options from all Dialog Modules.
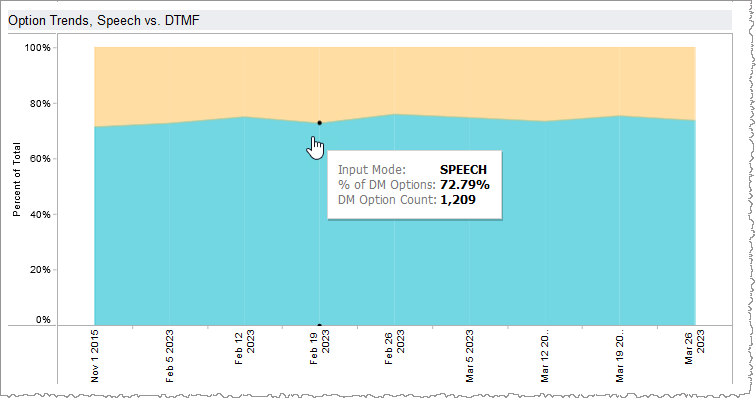
Option Trends, Speech vs. DTMF
In this graph, the percentage of Dialog Module visits that ended in a result from speech vs. those that ended in a result from DTMF are trended over time. By default this shows the cumulative percentages of results from all Dialog Modules.
Filters
Increase the specificity of your report by applying filters to the data. The DM Options Trends report's filters include Date, Date Granularity, and Dialog Module. Additionally, the report may include one or more other customized filters depending on what has been configured specifically for your system.
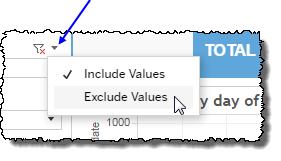
Clicking Include values displays only those data possessing the selected values. All other data are hidden from the visualization.
By contrast, clicking Exclude values displays only those data that do not possess the selected values.
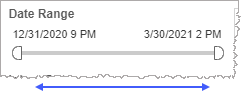
Date
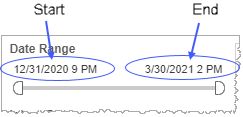
The Date Range filter is a slider with two moveable sides. By narrowing the date range, you display only data falling within the range.
In addition to the slider, the filter allows you to specify start and end points to the range by time of day as well as by date by clicking the Start and End regions, clicking a second time on the time of day, and then manually entering a new time of day.
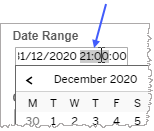
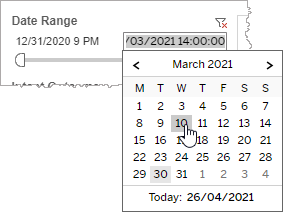
To select a date with the date picker, click the Start region to pick a date from the date picker widget. Do the same with the End region.
Date Granularity
The Date Granularity filter allows you to adjust the reported data granularity described by the trend lines. Drag the slider horizontally to adjust the granularity of reported data. Alternatively, you can use the left  and right
  arrow buttons to move the slider incrementally.

Dialog Module
Reduce the volume of reported data by specifying which Dialog Modules to include (to the exclusion of all other unselected Dialog Modules).
-
Click the Dialog Module field to see the drop-down list.
-
Select a Dialog Module from the list.
Custom filters
This report accommodates customizable filters.
Customizable filters narrow the scope of the reported dataset by including or excluding data with identifiable attributes. These attributes may be about the caller, the call itself, or about an event that may have happened during the call.
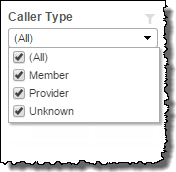
For example, one possible customizable filter you can add and customize in this view is Caller Type, in which you can narrow the reported data to include, or exclude, only those data with the selected caller type.
For more information about how to add customized filters to your view, contact your Nuance Professional Services representative.
Note: If you would like to modify this or any report, Nuance Communications, Inc. recommends you contact Nuance Professional Services.
