Caller Engagement
This view displays in two graphs the degree to which callers engaged with the application. You can filter by adjusting the time period displayed. Additionally, up to ten customizable filters may be available. These filters depend upon data from AFO (after-the-fact-outcome) files.
Note: This report is applicable only for clients using the IVR channel.

Visualizations
Legend
Color-coding in the graphs corresponds to individual disengagement reasons and are mapped in this report's Disengaged reasons legend.

- Instant Opt-Out - A call where the caller makes no attempt to interact with the IVR other than transferring to a live agent by request.
- Mute Caller - A call where the caller makes no attempt to interact with the IVR resulting in a transfer to a live agent (due to timeouts).
- Instant Hang-Up - A call that ends with the caller hanging up before making any attempt to interact with the IVR.
Engagement
This graph displays the proportion of calls in which callers engaged with the application. Hovering over the graph displays the selected week as well as the percentage of engaged calls for that week over the specified time frame.

Disengaged Details
This graph displays the proportion of calls in which callers were not engaged with the application and sub-categories therein. Hovering over color-coded regions in the graph displays information about the selected sub-category for that week over the specified time frame.

Filters
Increase the specificity of your dashboard's reporting by applying filters to the data. The Caller Engagement report's filters include Date and Date Granularity. Additionally, the report may include one or more other customized filters depending on what has been configured specifically for your system.
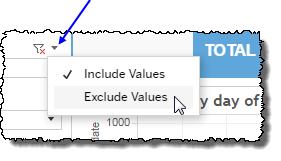
Clicking Include values displays only those data possessing the selected values. All other data are hidden from the visualization.
By contrast, clicking Exclude values displays only those data that do not possess the selected values.
Date
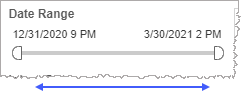
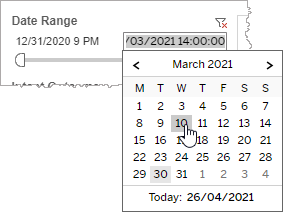
The Date Range filter is a slider with two moveable sides. By narrowing the date range, you display only data falling within the range.
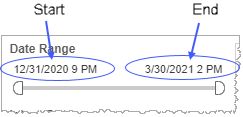
In addition to the slider, the filter allows you to specify start and end points to the range by time of day as well as by date by clicking the Start and End regions, clicking a second time on the time of day, and then manually entering a new time of day.
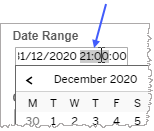
To select a date with the date picker, click the Start region to pick a date from the date picker widget. Do the same with the End region.
Date Granularity
The Date Granularity filter allows you to adjust the reported data granularity described by the trend lines. Drag the slider horizontally to adjust the granularity of reported data. Alternatively, you can use the left  and right
  arrow buttons to move the slider incrementally.

Custom filters
This report accommodates customizable filters.
Customizable filters narrow the scope of the reported dataset by including or excluding data with identifiable attributes. These attributes may be about the caller, the call itself, or about an event that may have happened during the call.
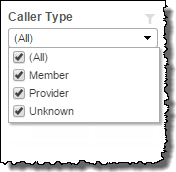
For example, one possible customizable filter you can add and customize in this view is Caller Type, in which you can narrow the reported data to include, or exclude, only those data with the selected caller type.
For more information about how to add customized filters to your view, contact your Nuance Professional Services representative.
Note: If you would like to modify this or any report, Nuance Communications, Inc. recommends you contact Nuance Professional Services.
