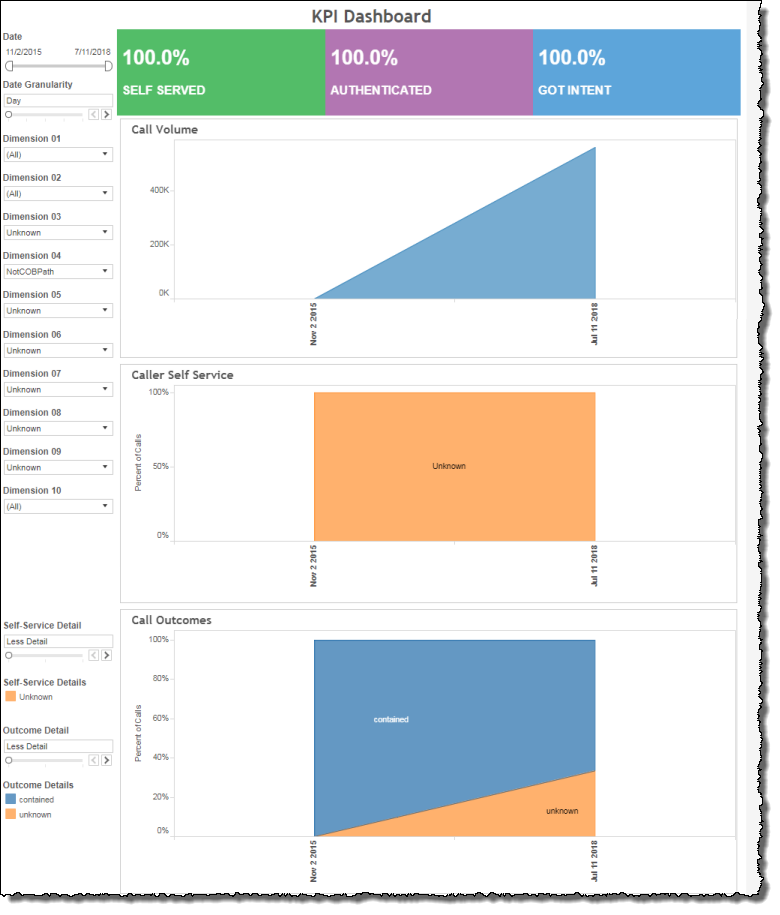
KPI Dashboard
This view shows key session-level metrics in a dashboard configuration.
Note: This report is applicable only for clients using the IVR channel.
Three trending graphs track call volume, caller self-service, and call outcome over time. The Caller Self Service graph and the Call Outcome graph provide sliders allowing you to adjust the level of detail visible within them. At the top of the report, additionally, are three tiles that are customizable. By default, the tiles display the proportion (in percent) of calls that were self-served, the proportion that were authenticated, as well as the proportion in which the caller intent was successfully recognized. You can filter by adjusting the time period displayed. Additionally, up to ten customizable filters may be available. These filters depend upon data from AFO (after-the-fact-outcome) files.
Visualizations
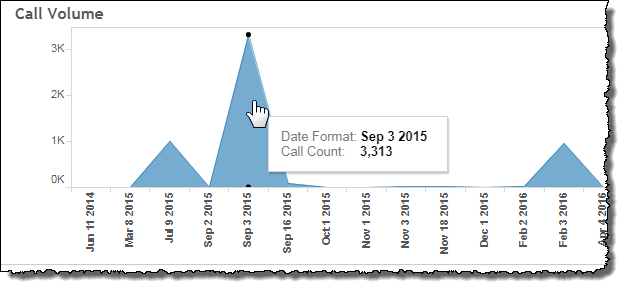
Call Volume
This graph tracks the session count number over time. Hovering over a point on the trend line that corresponds to a particular date on the x‑axis displays the selected week as well as the session count for that week over the specified time frame.
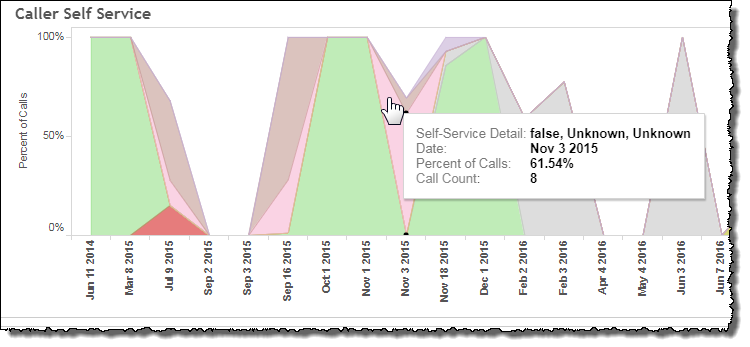
Caller Self Service
This graph displays the relative proportion of the constituent sub-categories of calls contained by self-service. The displayed proportions, it should be noted, are relative to the aggregate of all calls and not just self-served calls. Each of the displayed bands corresponds to a sub-category whose color is described in the Self Service Detail Legend to the left of the graph. Hovering over one of the bands in this graph identifies the self-service sub-category, and displays relevant information.
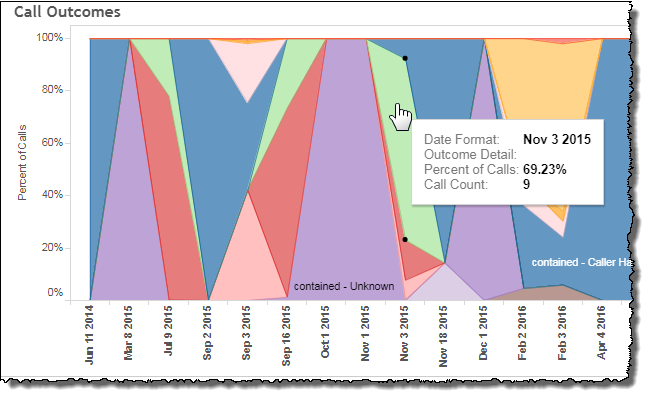
Call Outcomes
This graph displays the relative proportion of constituent sub-categories for all call outcomes. Each of the displayed bands corresponds to a call outcome whose color is described in the Outcome Detail Legend to the left of the graph. Hovering over one of the bands in this graph identifies call outcome and displays relevant information.
Filters
Increase the specificity of your report by applying filters to the data. The KPI Dashboard's filters include Date, Date Granularity, Self-Service Detail, and Outcome Detail. Additionally, the report may include one or more other customized filters depending on what has been configured specifically for your system.
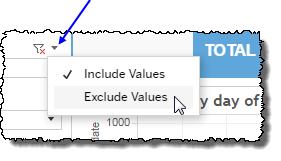
Clicking Include values displays only those data possessing the selected values. All other data are hidden from the visualization.
By contrast, clicking Exclude values displays only those data that do not possess the selected values.
Date
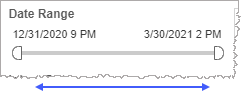
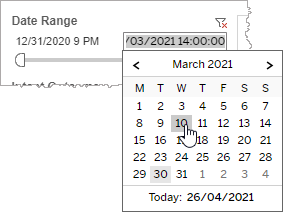
The Date Range filter is a slider with two moveable sides. By narrowing the date range, you display only data falling within the range.
In addition to the slider, the filter allows you to specify start and end points to the range by time of day as well as by date by clicking the Start and End regions, clicking a second time on the time of day, and then manually entering a new time of day.
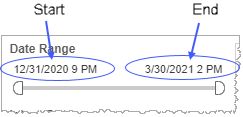
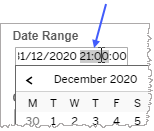
To select a date with the date picker, click the Start region to pick a date from the date picker widget. Do the same with the End region.
Date Granularity
The Date Granularity filter allows you to adjust the reported data granularity described by the trend lines. Drag the slider horizontally to adjust the granularity of reported data. Alternatively, you can use the left  and right
  arrow buttons to move the slider incrementally.

Self-Service Detail
This filter allows you to adjust the level of detail reported within the self-served category of calls.
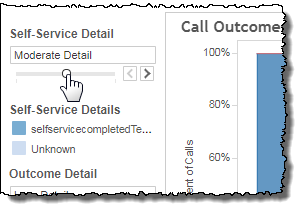
Drag the slider horizontally to adjust the granularity of reported data. Alternatively, you can use the left  and right
  arrow buttons to move the slider incrementally.
Note: Self-Served is one among several possible outcomes for a call. This is why the Caller Self Service graph displays the overall Self-Served outcome in the above example as being less than 100%.
Outcome Detail
This filter allows you to adjust the level of reported call outcome detail.
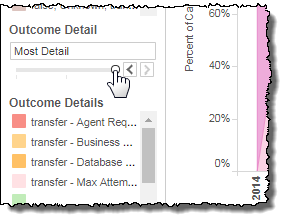
Drag the slider horizontally to adjust the granularity of reported data. Alternatively, you can use the left and right arrow buttons to move the slider incrementally.
Custom filters
This report accommodates customizable filters.
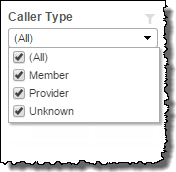
Customizable filters narrow the scope of the reported dataset by including or excluding data with identifiable attributes. These attributes may be about the caller, the call itself, or about an event that may have happened during the call.
For example, one possible customizable filter you can add and customize in this view is Caller Type, in which you can narrow the reported data to include, or exclude, only those data with the selected caller type.
For more information about how to add customized filters to your view, contact your Nuance Professional Services representative.
Note: If you would like to modify this or any report, Nuance Communications, Inc. recommends you contact Nuance Professional Services.
