Recognizer Traffic
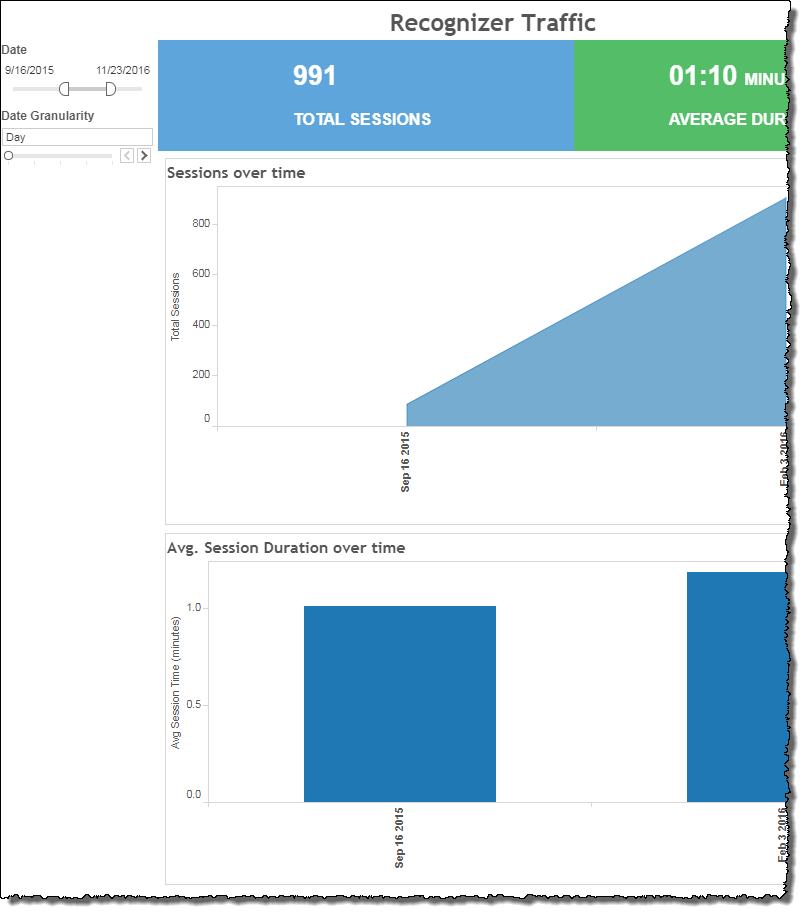
The Recognizer Traffic report is a trending graph of the raw number of sessions over a given period of time.
Note: This report is applicable only for clients using the IVR channel.
You can filter by adjusting the time period displayed as well as by caller type (if your administrator has included this optional customizable filter). You can also adjust the granularity of the data points reported (the Date Granularity filter). At the top of the report, additionally, are two widgets displaying the overall, raw count of the number of sessions as well as the average session duration. You can filter by adjusting the time period displayed. Up to ten customizable filters may be available.
Note: The underlying data for all Recognizer Traffic reports comes from Recognizer logs.
Increase the specificity of your dashboard's reporting by applying the Date filter (a non-customizable filter) to the data. Additionally, you may select the Recognizer Traffic report's visualization detail with the Date Granularity slider.
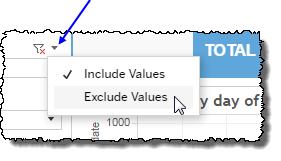
Clicking Include values displays only those data possessing the selected values. All other data are hidden from the visualization.
By contrast, clicking Exclude values displays only those data that do not possess the selected values.
Date
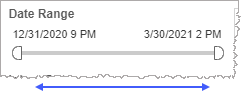
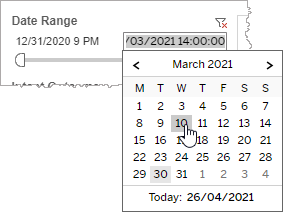
The Date Range filter is a slider with two moveable sides. By narrowing the date range, you display only data falling within the range.
In addition to the slider, the filter allows you to specify start and end points to the range by time of day as well as by date by clicking the Start and End regions, clicking a second time on the time of day, and then manually entering a new time of day.
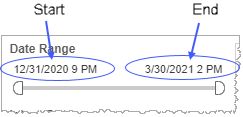
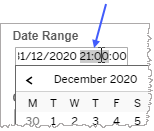
To select a date with the date picker, click the Start region to pick a date from the date picker widget. Do the same with the End region.
Date Granularity
The Date Granularity filter allows you to adjust the reported data granularity described by the trend lines. Drag the slider horizontally to adjust the granularity of reported data. Alternatively, you can use the left  and right
  arrow buttons to move the slider incrementally.

Note: If you would like to modify this or any report, Nuance Communications, Inc. recommends you contact Nuance Professional Services.
