Task Trends
This view displays the frequency with which broad categories of outcomes occur and how that metric changes over a given time period.
Note: Pay attention to tasks whose outcome is not improving or is getting worse over time.
Visualization
The Task Trends view's trending graph is a visualization of the broad task outcome categories for a given task over a period of time. Trends for each outcome are quantified in relative terms as a ratio against the other outcomes. The y‑axis of the chart is a scale from 0% to 100% and is a measure of the frequency at which a given outcome occurs relative to other outcomes over a specified time period.
Legend
This legend maps colors to the names of the broad task categories, visible as trend lines in the chart of the Task Trending view.
Filters
Increase the specificity of your report by applying filters to the data. The Task Trends report's filters include Date, Date Granularity, Task Name, Start Granularity, Task Version and Task Attempt. Additionally, the report may include one or more other customized filters depending on what has been configured specifically for your system.
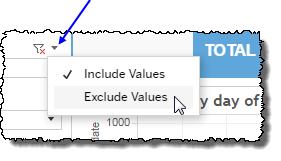
Clicking Include values displays only those data possessing the selected values. All other data are hidden from the visualization.
By contrast, clicking Exclude values displays only those data that do not possess the selected values.
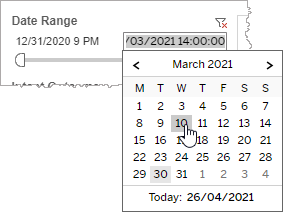
Date
The Date Range filter is a slider with two moveable sides. By narrowing the date range, you display only data falling within the range.
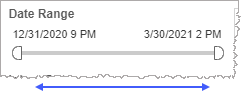
In addition to the slider, the filter allows you to specify start and end points to the range by time of day as well as by date by clicking the Start and End regions, clicking a second time on the time of day, and then manually entering a new time of day.
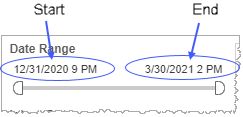
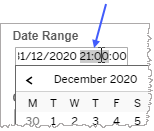
To select a date with the date picker, click the Start region to pick a date from the date picker widget. Do the same with the End region.
Date Granularity
The Date Granularity filter allows you to adjust the reported data granularity described by the trend lines. Drag the slider horizontally to adjust the granularity of reported data. Alternatively, you can use the left  and right
  arrow buttons to move the slider incrementally.

Task Name
The Task Name filter allows you to narrow the displayed data in your view by including only those tasks bearing the selected task name.
-
Click the Task Name field, and select the only task you would like to include in the view.
The Task Name filter is an auto-populated filter based on data made available in the AFT file.
Start Granularity
For dimensions that have distinct start conditions associated with them, you may choose to visualize your data as a graph for each start condition or else aggregate them into one graph. That is, if there are several distinct start conditions (for example Member and Provider), selecting Each Start Condition in the Start Granularity filter produces a visualization of the trending lines for each of Member and Provider on two separate graphs.
Task Version
The Task Version filter allows you to narrow the displayed data in your view by discriminately including task data associated with all, several, or only one task version.
A task version is the number identifying the revision of a task definition. Task definitions may change over time for a number of reasons. One example is if you find there are several navigational exits that are categorized as Other. In this case, you may want to recategorize them with more meaningful labels which, in turn, may warrant an update to your task definitions. Another example is if the application itself is updated such that there are now more states or more ways in which scenarios are handled. Again, in this case, you may want to revisit your task definitions with a new revision to correctly capture successes and failures.
The Task Version filter is an auto-populated filter based on data made available in the AFT file.
- Click the Task Version field.
-
Select the All checkbox to include data associated with all task versions.
If there are many task versions available and you would like to select one or just a few of them, clear the All checkbox and then select each task version you would like to include in your query.

Task Attempt
The Task Attempt filter allows you to narrow the displayed data in your view by discriminately including task data associated with all, some, or a single task attempt.
A task attempt is identified by an index number (for example, Attempt 1 or Attempt 2) and corresponds to a task being started. Notably, a task attempt does not necessarily end with a task completion. It is only necessary for the task to begin for it to be an attempt.
When filtering for task attempts, you may select one, several, or all task attempts:
- Selecting only one task attempt (attempt 3, for example) is a request to exclude all task data except data associated with a third attempt.
-
Broadening the filter to include several task attempts requests the reporting of data associated with the selected attempts, but excluding all other data.
For example, selecting attempts 3, 7, and 9 in the Task Attempt filter requests that only task data associated with the third, seventh, and ninth attempts of the given task(s) will be reported.
- Selecting all task attempts requests the reporting of task data associated with any and all task attempts. This filter parameter is the same thing as having no Task Attempt filter at all.
The Task Attempt filter is an auto-populated filter based on data made available in the AFT file.
Custom filters
This report accommodates customizable filters.
Customizable filters narrow the scope of the reported dataset by including or excluding data with identifiable attributes. These attributes may be about the session or about an event that may have happened during the session.
For more information about how to add customized filters to your view, contact your Nuance Professional Services representative.
Note: If you would like to modify this or any report, Nuance Communications, Inc. recommends you contact Nuance Professional Services.
