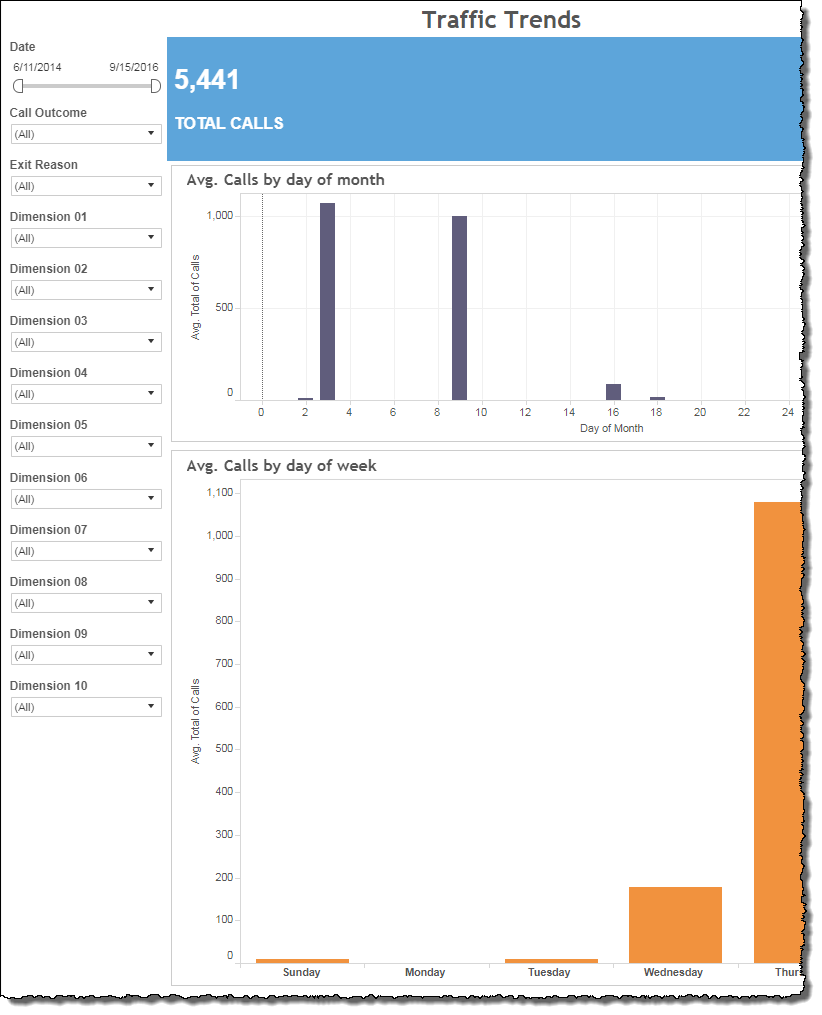
Traffic Trends
This view in the Traffic workbook plots a varying call volume trend line over time, as seen in two different trend graphs.
Note: This report is applicable only for clients using the IVR channel.
The graphs differ from one another only in terms of using different scales of measurement of time. You can filter by adjusting the time period displayed. Customizable filters are available and depend upon data from AFO (after-the-fact-outcome) files.
Visualizations
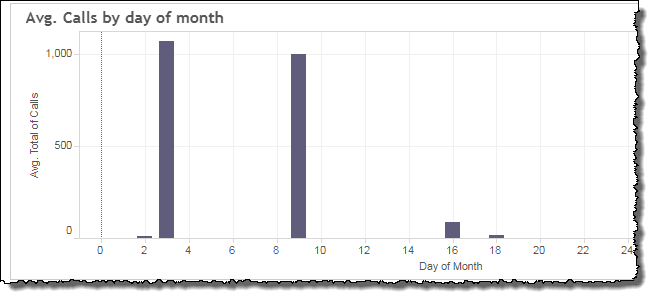
Avg. Calls by day of month
This graph plots the average number of sessions on a day of the month over a specified period of time.
Hovering over a histogram bar corresponding to a particular date on the x‑axis displays the selected day of the month as well as the calculated average for that day over the specified time frame.
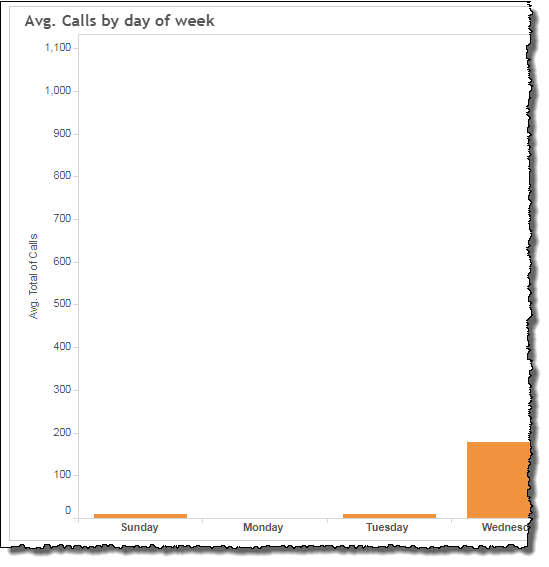
Avg. Calls by day of week
This graph plots the average number of sessions for individual days of the week over a specified period of time.
Hovering over a histogram bar corresponding to a particular week day on the x‑axis displays the selected day as well as the calculated average for that day over the specified time frame.
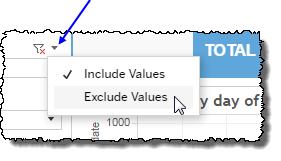
Filters
Increase the specificity of your view's reporting by applying filters to the data.
Clicking Include values displays only those data possessing the selected values. All other data are hidden from the visualization.
By contrast, clicking Exclude values displays only those data that do not possess the selected values.
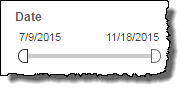
Date
The Date filter is a slider with two moveable sides. By narrowing the date range, you display only call data falling within the range.
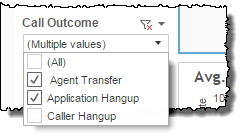
Call Outcome
By choosing one or more call outcomes from the list, you refine your data-set by including only those outcomes matching the names selected.
- Select all available call outcomes by selecting All.
- Select only one call outcome by first clearing the All checkbox, and then selecting the name of the outcome whose data you would like to see visualized.
-
Select several call outcomes (but a subset of all call outcomes) either by performing one of the following two actions:
- Clear the All checkbox, and then select the names of the call outcomes whose data you would like to see visualized.
- Select the All checkbox (or ensure it is already selected), and then clear the names of the call outcomes whose data you would NOT like to see visualized.
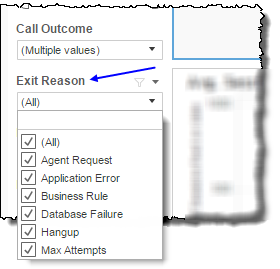
Exit Reason
By choosing one or more exit reasons from the list, you refine your data-set by including only those exit reasons matching the names selected.
- Select all available exit reasons by selecting All.
- Select only one exit reason by first clearing the All checkbox, and then selecting the name of the exit reason whose data you would like to see visualized.
-
Select several exit reasons (but a subset of all exit reasons ) either by performing one of the following two actions:
- Clear the All checkbox, and then select the names of the exit reasons whose data you would like to see visualized.
- Select the All checkbox (or ensure it is already selected), and then clear the names of the exit reasons whose data you would NOT like to see visualized.
Custom filters
This report accommodates customizable filters.
Customizable filters narrow the scope of the reported dataset by including or excluding data with identifiable attributes. These attributes may be about the session or about an event that may have happened during the session.
For more information about how to add customized filters to your view, contact your Nuance Professional Services representative.
Note: If you would like to modify this or any report, Nuance Communications, Inc. recommends you contact Nuance Professional Services.
