Mix Answers Summary
This report presents a visualization of the answers provided by Mix. It includes the raw counts of answers that Mix found, didn't find, or didn't initiate, which are subsequently used for in-depth analysis. The report is split into two sections, each offering a concise overview of Mix's responses.
In addition to the use of report filters, Nuance Insights allows you to manipulate displayed data through several other means in order to better visualize information. Select from the following to learn more:
Visualizations
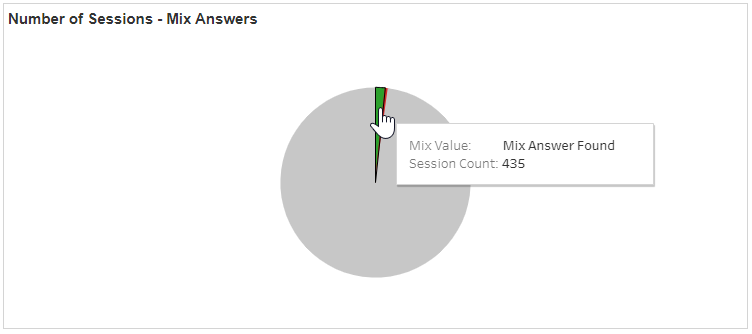
Number of Sessions - Mix Answers
The data for this section can be seen as a graphical visualization which is in form of a pie chart. The Mix values are three, resulting in the pie chart being split into three sections: Mix Answer Found , Mix Answer Not Found , and Mix Not Initiated .
In the example below, there were 435 session count for Mix Answer Found value.
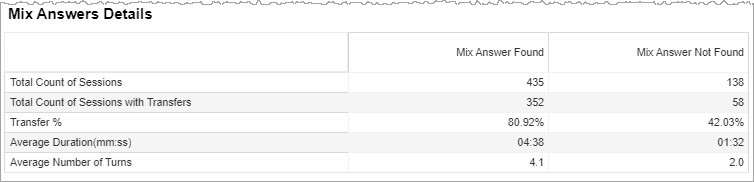
Mix Answers Details
The data for this section can be seen in a tabular form. Selecting a segment in the pie chart for any Mix values will highlight the corresponding row in the table and vice versa.
Filters
Increase the specificity of your view's reporting by applying filters to the data.
Clicking Include values displays only those data possessing the selected values. All other data are hidden from the visualization.
By contrast, clicking Exclude values displays only those data that do not possess the selected values.

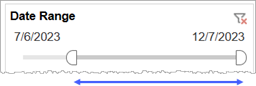
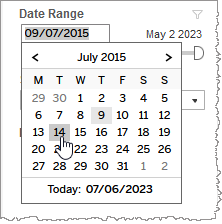
Date Range
The Date Range filter is a slider with two moveable sides. By narrowing the date range, you display only data falling within the range.
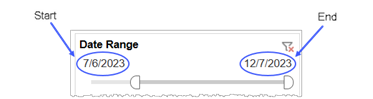
Alternatively, to select start and end dates with the date picker, click the Start region to pick a date from the date picker widget. Do the same with the End region.
Channel (filter)
By choosing one or more channels from the list, you refine your displayed data-set by including data from only those channels matching the selection.
- Select all available values by selecting All.
- Select only one value by first clearing the All checkbox, and then selecting the value whose data you would like to see visualized.
-
Select several values by doing one of the following:
- Clear the All checkbox, and then select the values whose data you would like to see visualized.
- Select the All checkbox and then clear values whose data you would NOT like to see visualized.
Mix Values (highlight tool)
Use this filter to highlight data having one or several specified Mix values.
- In the highlight tool, mouse over the word Mix Values to see the highlighter icon to the right.
-
Click the highlighter icon to toggle on (
 ) to highlight Mix values, or off (
  ) to remove highlighting.Notes:
- To make multiple selections, hold down the ctrl key while individually clicking desired Mix values.
- If you made a highlighter selection of Mix values and then toggled the highlighter function off, the last selection is preserved when you once again toggle the highlighter back on.
Custom filters
This report accommodates customizable filters.
Customizable filters narrow the scope of the reported dataset by including or excluding data with identifiable attributes. These attributes may be about the session or about an event that may have happened during the session.
For more information about how to add customized filters to your view, contact your Nuance Professional Services representative.
Note: If you would like to modify this or any report, Nuance Communications, Inc. recommends you contact Nuance Professional Services.
