Q and A Node Options
The Q and A Node Options report details, on a per channel basis, how people interact within the Q and A node state and details options selected for each Q and A node.
In addition to the use of report filters, Nuance Insights allows you to manipulate displayed data through several other means in order to better visualize information. Select from the following to learn more:
Visualization
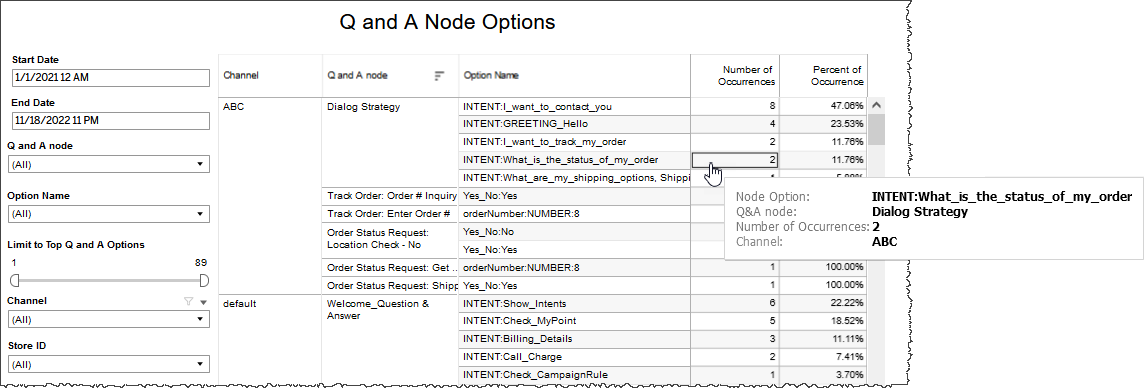
The main table displays detailed results for each Q and A node on a per channel basis. For each Q and A node, this table lists a raw count and a percentage distribution of the results for each Q and A node state including the visits that resulted in No Result. With this table users get a picture of how each successful visit ends and what percentage of visits are not successful.
-
Channel - Channel the data belongs to
-
Q and A node - Q and A node state in question, full state name given
-
Option Name - One of the interpreted user intents in a Q and A node
-
Number Occurrences - Raw count of how many times an option was recognized at the state
-
Percent of Occurrence - Percentage for each option from the total number of results per Q and A node
Filters
Increase the specificity of your view's reporting by applying filters to the data.
Clicking Include values displays only those data possessing the selected values. All other data are hidden from the visualization.
By contrast, clicking Exclude values displays only those data that do not possess the selected values.

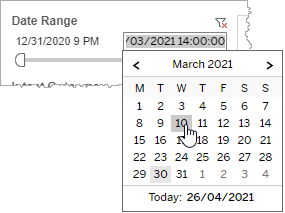
Date Range
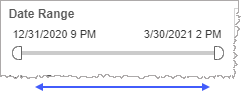
The Date Range filter is a slider with two moveable sides. By narrowing the date range, you display only data falling within the range.
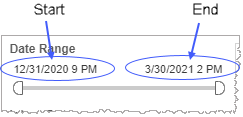
In addition to the slider, the filter allows you to specify start and end points to the range by time of day as well as by date by clicking the Start and End regions, clicking a second time on the time of day, and then manually entering a new time of day.
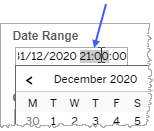
To select a date with the date picker, click the Start region to pick a date from the date picker widget. Do the same with the End region.
Q and A node
Reduce the volume of reported data by specifying which Q and A nodes to include (to the exclusion of all other unselected Q and A nodes).
Selecting All effectively negates the filtering effect of this filter. Clearing the All checkbox filters out all Q and A nodes. This is particularly useful if you want to select just a few Q and A nodes. By clearing the All checkbox, and then selecting the few you would like to include, you avoid the step of individually having to clear each of the individual checkboxes of the Q and A nodes you do not want to include.
Option Name
Reduce the volume of reported data by selecting one, several or all options.
In each Q and A node, the application prompts the user with a question. The user responds with an answer. An option is the application's interpretation of the user's answer. There can be several user inputs that map to any one option. For example, in answer to an IVR-posed question, a user might answer, "I want to make a payment." Alternatively, the user might answer, "Make a payment." In either case, the IVR maps the user's answer to the option makePayment.
Once one or more options are selected in the Option Name filter, all other data whose user inputs do not map to the selected options are filtered out.
Limit to Top Q and A Options
The Limit to Top Q and A Options filter allows you to limit the number of displayed options based on their frequency. Enter a range in the one-sided slider. For example, entering the range 1 to 4 with the slider makes the report display only the most frequent option through to the fourth most frequent option in each Q and A node. All other options are not displayed.
Channel
By choosing one or more channels from the list, you refine your displayed data-set by including data from only those channels matching the selection.
- Select all available values by selecting All.
- Select only one value by first clearing the All checkbox, and then selecting the value whose data you would like to see visualized.
-
Select several values by doing one of the following:
- Clear the All checkbox, and then select the values whose data you would like to see visualized.
- Select the All checkbox and then clear values whose data you would NOT like to see visualized.
Custom filters
This report accommodates customizable filters.
Customizable filters narrow the scope of the reported dataset by including or excluding data with identifiable attributes. These attributes may be about the conversation itself or about an event that may have happened during the conversation.
For more information about how to add customized filters to your view, contact your Nuance Professional Services representative.
Note: If you would like to modify this or any report, Nuance Communications, Inc. recommends you contact Nuance Professional Services.
