Creating tables
Step 1: Alert type and date range
For either Table or Chart reports:
- Select Alert Type, Date Range, and Data Includes options.
- Click Get Data Choices in the lower right of the Step 1: Alert Type & Date Range section.
Alert Type & Date Range
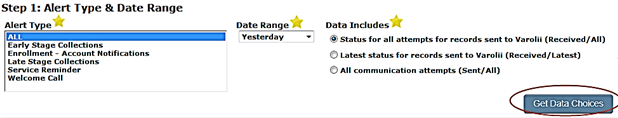
Note: When Get Data Choices is clicked, the system retrieves a small sample of data to use in the preview report displayed on the bottom of the screen. This is intended to help you design your reports. This data is NOT a complete set and should NOT be used for business purposes.
Tip: Any time you make changes in the Step 1: Alert Type & Date Range section, click the Get Data (Get Sample Data) button again so the content in the remaining sections update based on the new settings.
When you do this any configurations you have made are reset.
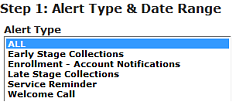
Alert Type
For the Alert Type use the default value ALL, which provides all alert types in your report, or select one or more specific Alert Types from the list.
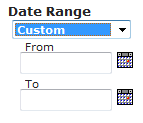
Date Range
Select a predefined date range or select Custom and enter From and To date ranges for this report.
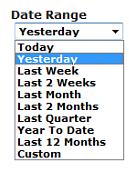
For all options other than Custom, the date range is always in relation to the day the report is processed.
When you schedule a report for Last Week and it is scheduled to process every Monday, the resulting report is always for the previous week in relation to the date it is being processed.
The system recognizes leap years and the number of days in each month.
Date ranges are shown in the table.
Data Includes
Select one of the provided options:
Option 1: Status on all attempts sent to Nuance (Received/All)
- When files/records were sent to Nuance, status on all attempts.
- These are the records you sent to Nuance during the specified date range, no matter when the notification activity actually occurred.
- The number of alerts received is based strictly on the specified date range.
Option 2: Latest Status for records sent to Nuance (Received/Latest)
- When files/records were sent to Nuance, status on latest attempt only.
- These are the records you sent to Nuance to process during the specified date range, no matter when those records were processed.
- The number of alerts received is based strictly on the time range of the specified date range.
For either of the above options:
- If you send the Monday file before midnight Monday morning, those records do not count as Monday records, they count as Sunday records.
- If the date range you specify does not include Sunday, none of those Monday records show in an alerts-received report.
Option 3: All communication attempts (Sent/All)
- When communication attempts were made, status on all attempts.
- These are alerts Nuance dispatched to your customers (and messages your customers retrieved in response to an alert) during the specified date range, no matter when Nuance received records for those alerts.
Alerts Received Report Descriptions
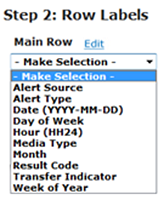
Step 2: Row Labels
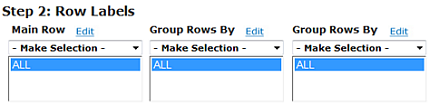
For each of the fields on the Step 2: Row Labels section use the selection menus drop-down list to select a dimension, then use the default selection ALL or further filter the reports data by selecting one or more values of that data category.
Selection Menu Choices
After you make your choice from the selection menus, the selection list populates with values based on the category you choose. See Editing the Label to change the label for a row or column.
Main Row
The Main Row indicates the organization of the data seen in the report. The default value All groups report data into rows based on the type of data you select from the menu. If you choose one or more values from the selection list your report additionally filters to only include records with that data value or values.
Main Row
Group Rows By
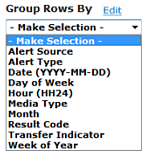
This groups the rows for presentation. A second Group Rows By option can further reorder your reports data. The default value All further organizes report data into rows based on the type of data you select from the menu. If you choose one or more values from the selection list(s) your report filters to only include records with that data value or values.
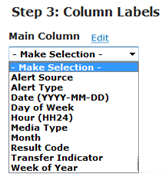
Step 3: Column Labels
Column Labels
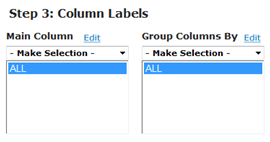
For each of the fields on the Step 3: Column Labels section use the selection menus drop-down list to select a dimension.
Next use either the default selection ALL or further filter the reports data by selecting one or more values of that data category.
See Editing the Label to change the label for a row or column.
Main Column
The Main Column indicates the organization of the data seen in the report. The default value All organizes data into columns based on the type of data chosen from the menu. Selecting one or more values from the list filters the report to only include records with that data value or values
Column Labels Main Column
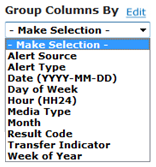
This groups the columns for presentation. The default value All further organizes report data into rows based on the type of data you selected from the selection menu.
If you choose one or more values from the selection list(s) your report additionally filters to only include records with that data value or values.
Step 4: Report Data
Report Data
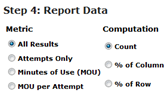
- Attempts: Any dispatch with a result code other than BD Bad Data, C Alert Cancelled or EX Expired is an attempt.
- Non Attempts: Any record with a result code of BD Bad Data, C Alert Cancelled or EX Expired is a non-attempt.
- Minutes Per Use (MOU): The number of phone line minutes and minutes used by the system to process voice notifications.
- MOU per Attempt - The Minutes of Use (MOU) divided by the number of Attempts.
- Count: Provides the data in counts.
- % of Row: Provides the data in percentages across each row.
- % of Column: Provides the data in percentages down each column.
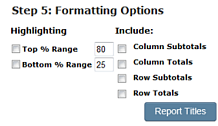
Step 5: Formatting Options
Highlighting
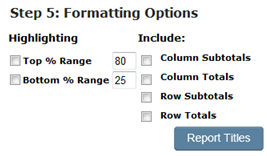
- Top % Range: Highlights, in yellow, all the cells that are at or higher than the percentage value you specified. For example, if you enter 10, all cells with the highest 10% of values are highlighted in yellow.
- Bottom % Range: Lowlights, in red, all the cells that are lower than the percentage value you specified. For example, if you enter 15, all cells with the lowest 15% of values are highlighted in red.
| Option | Description |
|---|---|
| Column Subtotals | Provides additional rows for each group by value on each column of data. |
| Column Totals | Provides an additional row at the bottom containing the totals for each column of data. |
| Row Subtotals | Provides additional columns for each group by value on each row of data. |
| Row Totals | Provides an additional column containing the totals for each rows data. |
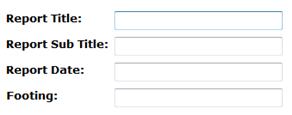
Report Titles
Formatting Options
Step 6: Output Format
Reports: Output Format
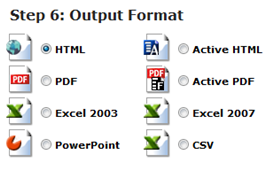
Output Format selects the format delivery of the final report.
Active HTML & Active PDF - HTML or PDF contain Active Technology which embeds the data and the analytic engine. This allows you to manipulate report contents into diverse permutations on their own and forward these reports to other users with no network or device constraints, which improves efficiency and facilitates collaborative decision-making.
