View campaign delivery results
Use the Results panel to view the realtime results of delivery attempts made for a campaign. You can specify the time period and media types to include. The pie chart shows the results of all attempts for a record, even those that were unsuccessful. For example if a record initially has two 'Busy' results and later 'Live Answer' result, then all three results are represented in the pie.
For a full list of possible results and their meaning, see Result code reference.
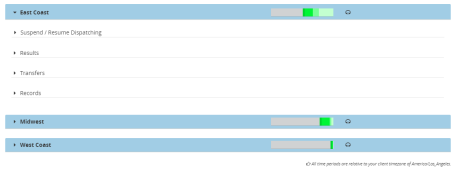
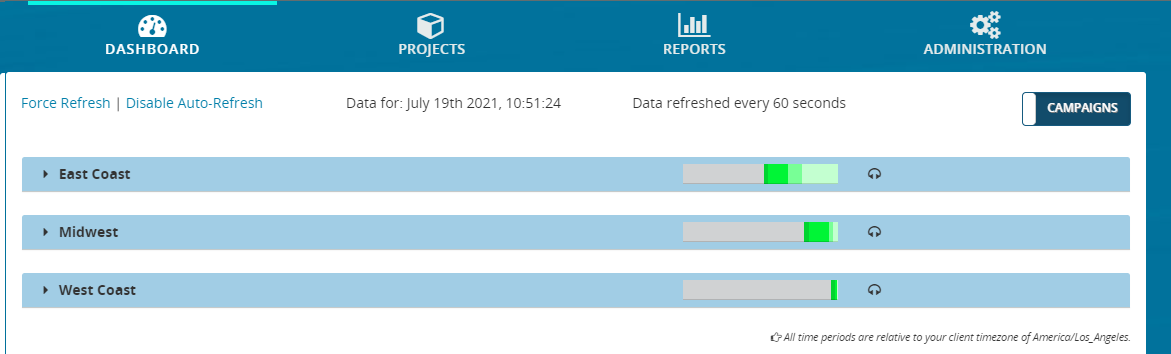
- From the header bar, click DASHBOARD. This displays a list of campaigns:
- Locate a campaign and click anywhere on it. This displays the panels for Suspend / Resume Dispatching, Results, Transfers, and Records
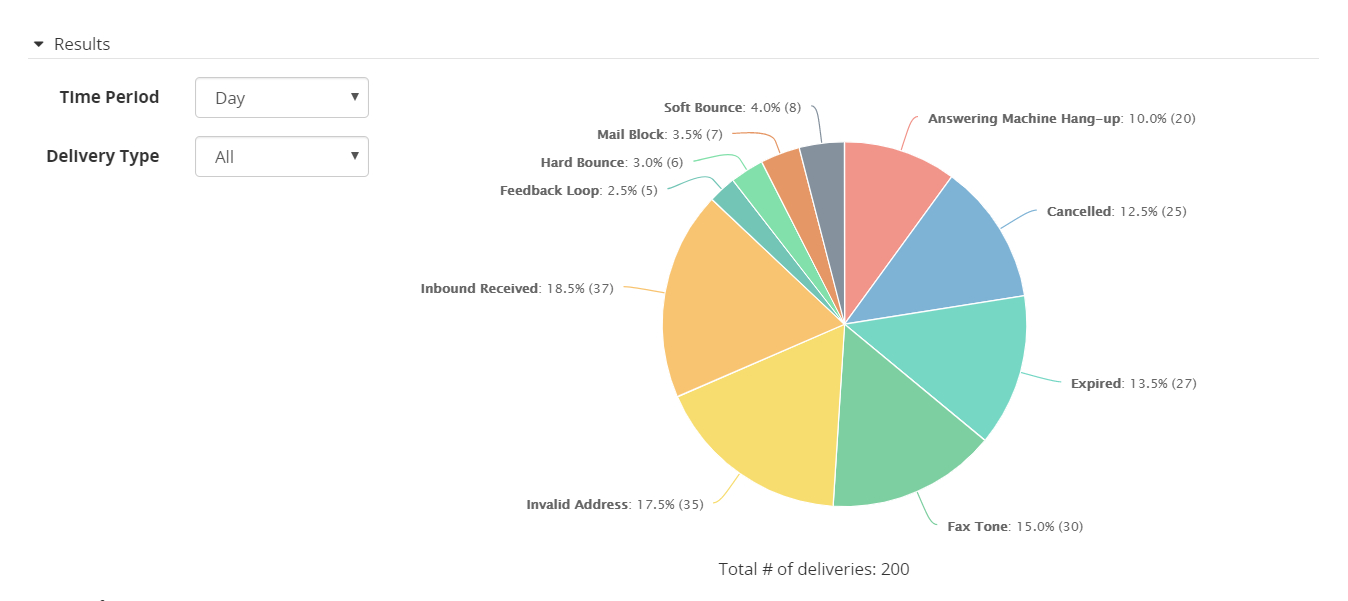
- Click Results. This expands the Results panel, showing realtime results of all delivery attempts for that campaign.
Each Results panel contains the following filter:
| Section |
Description |
| Time Period
|
Select the time period of the results to display. Can be Current Hour and Day. The Day setting is relative to the time zone of the client, which is displayed at the bottom of the page and may be different from the user's time zone. |
| Delivery Type
|
Select the media type of the results to display. Can be Voice, Email, Sms, Web, or All. The dropdown displays only those media types that were used in deliveries. |
| Results pie chart
|
Shows a pie chart representing all deliveries made in the selected time period. The percentage of deliveries for each result is indicated by a label and unique color. For example, in the above pie chart, 10 percent of all deliveries (20 out of 200 total) resulted in Answering Machine Hangup. Notice that this pie chart includes results for all delivery types. If you want to see results for voice messages only, select Voice. This hides the results for other delivery types, such as email. |