View throttle delivery results
Use the Results panel to view the realtime results of delivery attempts made using a throttle. You can specify the time period and media types to include. The pie chart shows the results of all attempts for a record, including unsuccessful attempts. For example if a record initially has two 'Busy' results and later a 'Live Answer' result, then all three results are represented in the pie.
For a complete list of possible results and their meaning, see Result code reference.
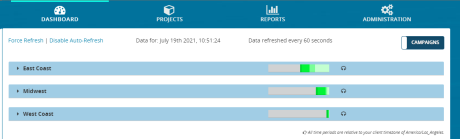
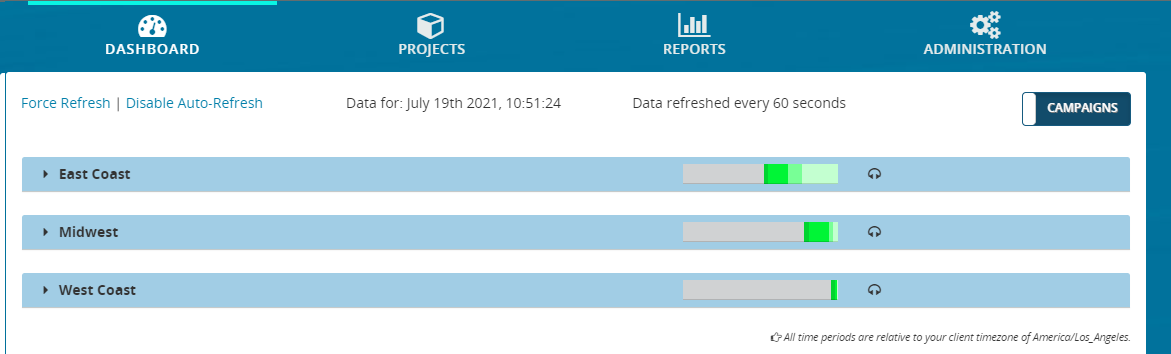
- From the header bar, click DASHBOARD. This displays a list of campaigns:
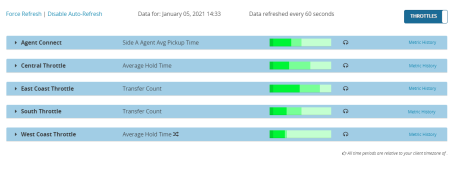
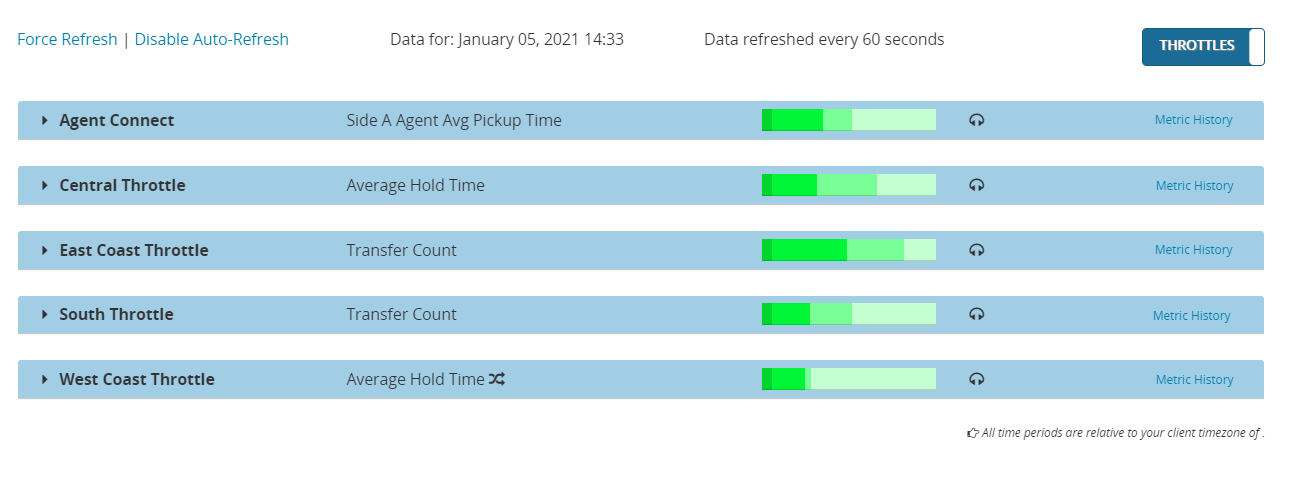
- Click the Campaigns toggle to switch to Throttles view. This displays a list of throttles. For example:
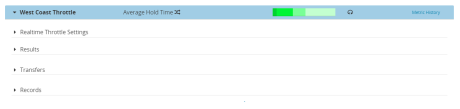
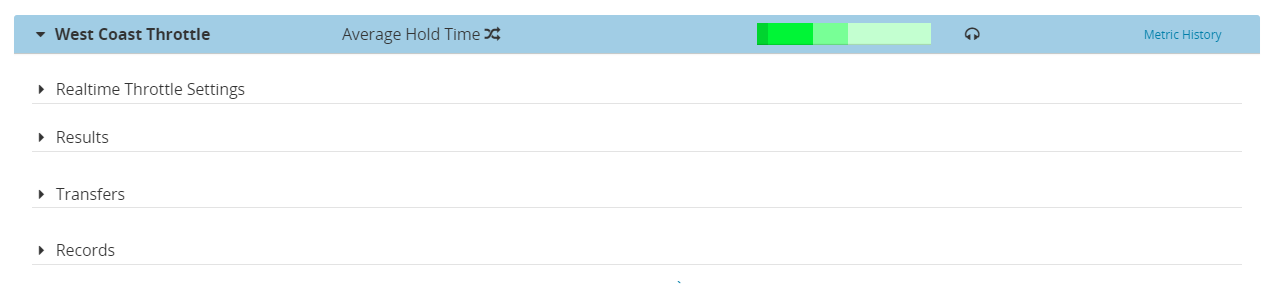
- Locate a throttle and click anywhere on it. This displays the panels for Realtime Throttle Settings, Results, Transfers, and Records.
- Click Results. This expands the Results panel, showing realtime results of all messages sent for that throttle.
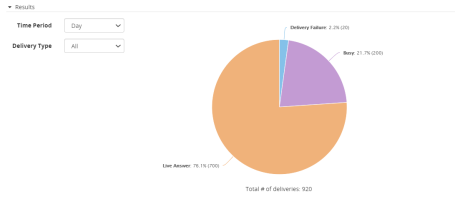
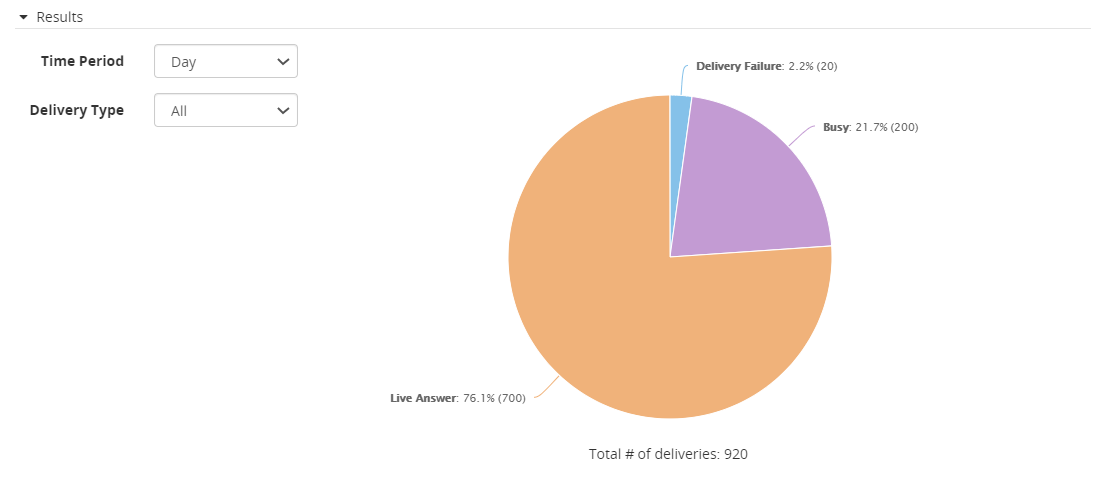
Each Results panel contains the following sections:
