Monitor and manage throttles
Throttles manage capacity constraints in projects that have transfers to agents or IVRs (Interactive Voice Responses) to monitor and adjust the dispatch rate of transfers to client call centers.
To gauge the status of the call center, each throttle has a Call Center Metric setting. For each type of metric, configurable parameters specify the highest acceptable, optimal, and lowest acceptable values of the metric. Every 60 seconds, the platform determines the current value of the metric and then it adjusts the dispatch rate to bring it closer to the optimal value. This is similar to the way the cruise control system in a car monitors the car's speed and adjusts the throttle to provide more power when the speed is below the target value, and less power when it is above the target speed.
For example, suppose you have a project that warns consumers about unusual or high-dollar credit card transactions and offers the option to speak with an agent. If you want an average hold time of 60 seconds, set Control Mid to 60 seconds. The dispatch rate automatically adjusts to keep the average hold time at that level. Note that the platform receives data about call center hold times only from calls that it places, and it is not aware of volumes or hold times for other calls coming into the call center.
The Throttles view enables to view the status of all throttles and modify their settings. An indicator bar is displayed for each throttle. The bar is divided into colored bands that indicate the earliest scheduled time to send records in inventory. Click the throttle’s panel to display its settings and details about its records, results, and transfers. All throttles that are currently defined for the client are displayed in the Throttles view, whether or not they are in use. If a throttle is not in use, the bar does not display any data.
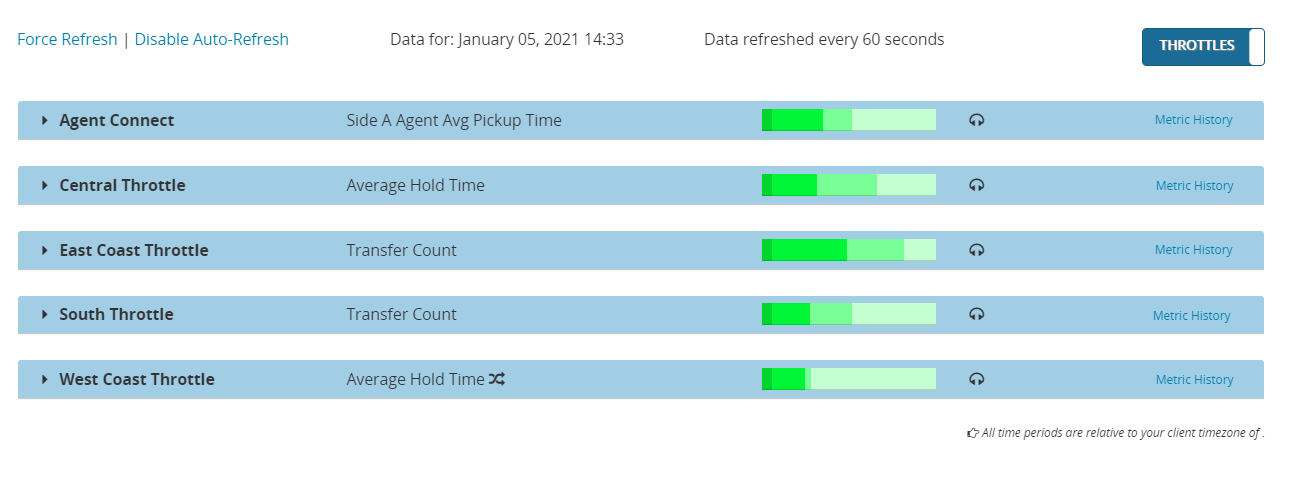
This example of the Throttles view shows five throttles in use:
When a record is loaded, it is assigned to a campaign based on your project's business logic. The Realtime Throttle setting for the campaign indicates whether a throttle should be used. If so, it specifies which throttle to use.
The indicator bars show records that are loaded into inventory. Records scheduled for sending are shown in various shades of green, with the darkest green shade denoting records ready to send immediately and the lightest shade denoting records scheduled to be sent in 30 minutes or more. The size of each colored band is proportional to the percentage of loaded records in that status. Hover over a colored band to see the number of records it contains.
Completed records are not shown in Throttles view. To see completed records, switch to the Campaigns view.
Each throttle indicator displays the throttle metric selected for the throttle, such as Average Hold Time or Transfer Count.
The indicator bar uses the following colors to show status:


The display automatically refreshes the data every 60 seconds.
