The Results Panel
As you create or modify a template, the Results Panel displays the Layout Canvas in the default Interactive Design view and in Document view, or the Query Design pane when you select Query Design view.
When running a report, the Results Panel displays the Output window. If the output window is closed or if there is no report to preview, the Results Panel is blank.
You can select Query Design View or Interactive Design View from the View and Home tabs, Design Group.
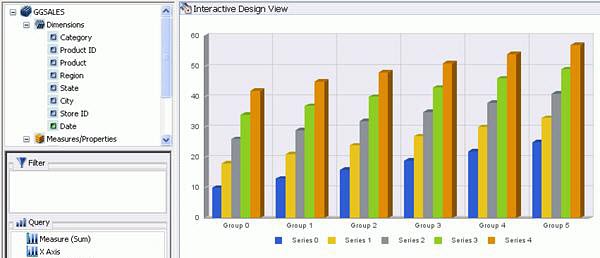
The Results Panel displays a chart preview when you first enter Report Creator to create a chart. The Results Panel is the large working area to the right of the Resources panel.
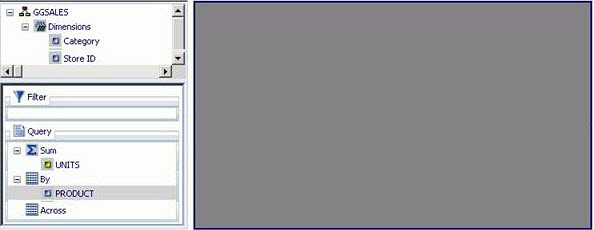
After executing a report to generate output, if you minimize or close the Output window, the Results Panel displays an empty space.
Results Panel after Execution
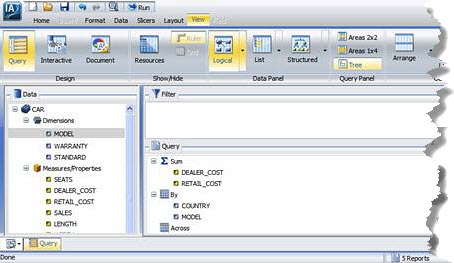
Query Design Results panel
In Query Design view, the Results panel displays the Query Design pane.
This larger layout is useful when designing a report with multiple filters or numerous fields.
The following image shows the Query Design pane in the Results Panel of the Report Creator application window. It is displaying report field containers that include Filter, Sum, By, and Across.
The Layout canvas
- In Interactive view, the Results panel displays the Layout Canvas.
The Layout Canvas displays a preview of the report being created or modified. The Layout Canvas is always fully maximized (in the Results Panel) and cannot be minimized, cascaded, or tiled. However, whenever no report exists, a blank canvas is displayed.
The Layout Canvas displays either actual data or sample data, depending on whether you selected Data from Source (the default) or Use Sample Data in the Home tab, Design group.
Selecting Data from Source
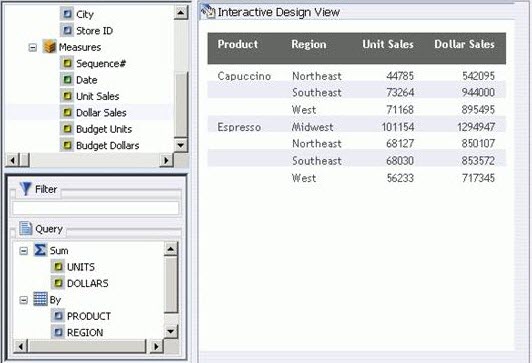
A live preview of the report being built is refreshed in the Layout Canvas as you add and remove data source fields in the report.
Selecting Use Sample Data
The Layout Canvas displays sample data from the Master File with the same formatting and style used to display live data.
The Output window
When you run a report, the output is displayed either as an output window in the Results Panel or in a new browser window.
- Output window and tab options are also available in the Status Bar.
- Output window display options are also available in the Navigation Task Bar.
You can select these options in the View tab, Output Window group:
Output view options
Control how multiple output windows are displayed.
Output target options
Control how the browser window is handled when you run a report.
Output format options
Determine the format of the report shown in the output window.
Tip: When you run a report, tab focus is on the output window, and pressing the Tab key does not move the selection.
- To move the Tab focus out of the output window, press F6.
Output view options
Output view options control how multiple output windows are displayed. The output view options are:
- Cascade
- Tile Horizontally
- Tile Vertically
- Switch
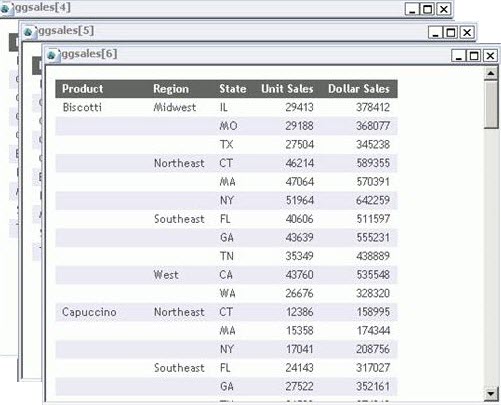
When you select Cascade, if multiple output windows exist, they are cascaded diagonally across the Results Panel. This option does not affect open browser windows when you select New Window or Single Window.
Cascade view
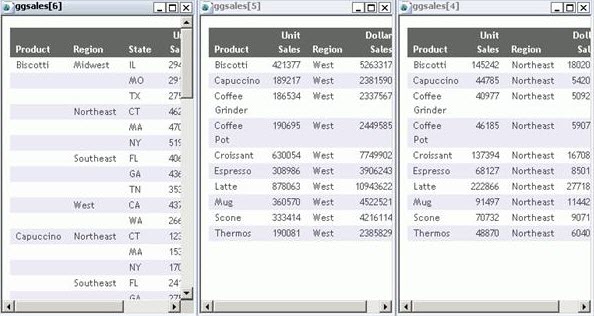
When you select Tile Horizontally, if multiple output windows exist, they are tiled horizontally, one above another, across the Results Panel. This option does not affect open browser windows when you select New Window or Single Window.
When you select Tile Vertically, if multiple output windows exist, they are tiled vertically, side by side, across the Results Panel. This option does not affect open browser windows when you select New Window or Single Window.
Tile Horizontally
Tile Vertically
When selecting Switch, a drop-down menu opens, where you can select any active report to view the output. The selected report is loaded into the output window or browser window, depending on the selected output window or tab option.
Output target options
Output target options control what happens to the output window when you run a report.
Output format options
The Output window can display report output in any of the supported formats
