Generating billing reports
Billing reports (available on the Billings tab) show the runtime use of Speech Suite features as allowed by your license agreement with Nuance.
Management Station generates reports using summarized data. Data summarization occurs automatically every hour. Since the data for hour X are summarized in hour X + 1, there is always a one-hour lag. This means a month is not “complete” until after 1 a.m. of the following month.
Note: All sites must generate billing reports and send them to Nuance. Contact your Nuance account manager for details on this procedure. (Exception: sites with perpetual Nuance licenses do not require billing reports. See Turning off billing and capacity monitoring reports.)
Depending on your license type, the billing reports show:
- Minutes Usage report: Shows the total amount of time, in minutes, used by recognition and TTS resources in the network for a specific time period.
- Peak Port Usage report: Shows the maximum number of ports used simultaneously by recognition and TTS resources in the network for a specific time period.
- Transaction Counts report: Shows the total number of transactions (requests) for recognition and TTS resources for a specific time period.
- Transaction Counts report: Shows the total number of sessions during a period of time.
In addition your billing reports show the license tier activated for recognition events. The license tier represents the kinds of grammars activated for recognition during conversations and allowed by the license. The tier values are in a range of 1-4 and Premium. For example, simple, built-in grammars with limited word counts are tier 1, and natural-language-understanding grammars with unlimited word counts are tier 4, and Dragon Voice recognitions are Premium tier.
The reports only show the highest license tier activated. For example, if tier 1 grammars and Premium are activated, only Premium appears in the report.
Specifying report filters
You can generate billing reports by month or year. Each report has a summary and details. For example:
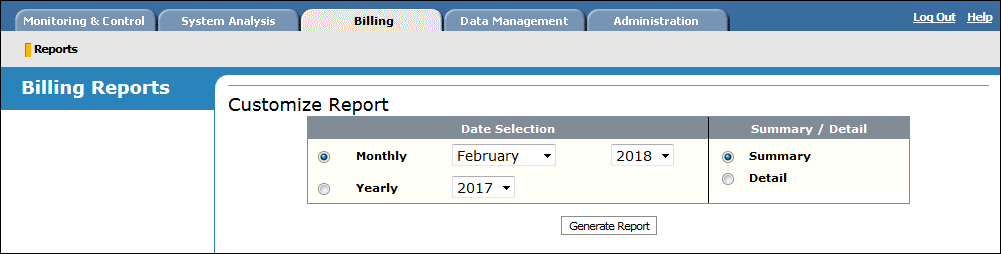
Available filters:
- Date selection: Specify a past month and year. The year cannot be more than three years back.
The default is the most recent month of summarized statistics.
- Summary / Detail: The summary report provides totals for the ASR, TTS, and live agent usage across the network. The detailed reports show this information by Company name, as defined in the application's session.xml file. See Configuring application sessions.
Exporting and sending billing reports to Nuance
As part of your license agreement, you must send the report to Nuance on an arranged schedule. For security reasons, this file is encrypted.
- Generate a summary or detailed report:
- Click Export to Encrypted CSV.
- Save the file.
- Email the encrypted file to Nuance.
For your own use, Nuance provides a way to export a report in a non-encrypted CSV format.
If Nuance asks you to send a dump of all statistics data for further analysis, navigate to Data Management→Export Statistics Data to find this feature.
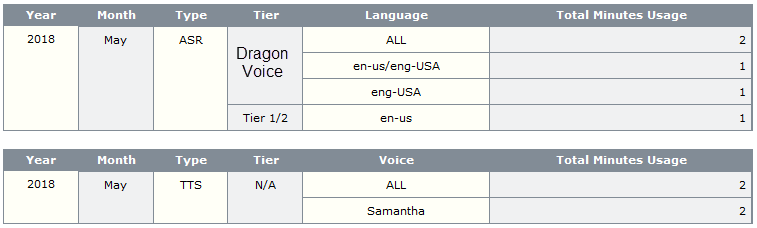
This report shows the total time (minutes) used by recognition and TTS resources in the network. After you set filters and click Generate, the report appears in the lower part of the same page.
The report divides usage by:
- ASR (language): Shows the total minutes of recognition in the network. Also shows highest tier type enabled for recognition.
In a single call, there is one ASR session. The duration starts at the first recognition request and ends when the call ends (caller hangs up or is transferred to an agent). The total minutes is the sum of all these ASR sessions.
- TTS (voice): Shows the total minutes for TTS usage in the network. Tier information is not applicable and appears as N/A.
A single call can have several TTS sessions, each with its own duration starting from the request to the release. The total minutes is the sum of all TTS requests in each call, for all calls during the specified time period.
This example shows part of a detailed Minutes Usage report for the month of February. To understand how the results are calculated, see How the system calculates usage statistics.
This report shows the maximum number of simultaneous ports used by recognition and TTS resources in the network for a specified time period. (Unlike other reports, which show total numbers, this report shows the maximum number of simultaneous ports.) After you set filters and click Generate, the report appears in the lower part of the same page.
Note: Alternatively, you can use the command-line to generate this report (instead of using the Management Station station). This is especially useful in multi-tenant environments when you have more than one Management Station server and Nuance network. See Generating billing reports.
The report shows simultaneous peak usage by:
- ASR (language): Shows the maximum number of simultaneously active ports for recognition resources. "Simultaneous" usage occurs when ASR sessions overlap. Each session begins upon the first ASR request and continues until the end of the call. The report divides results by the recognition tier type, it displays one row for the max simultaneous ports for each language (DTMF usage appears as N/A), and it shows the overall maximum (regardless of language).
- TTS (voice): Shows the maximum number of ports used simultaneously by TTS resources for the specified time period. Simultaneous port usage occurs when TTS sessions overlap. Tier information is not applicable and appears as N/A.
Example: This example illustrates that "ALL" is not merely a total for the individual rows
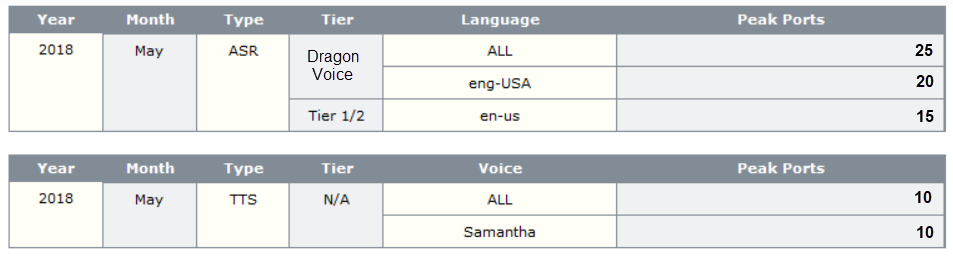
Above, the example shows:
- ASR tier 1 and 2: during the month there were never more than 15 en-US ports in use at the same time. (The value 15 could have been reached more than once.)
- ASR premium tier: there were never more than 20 eng-USA ports at the same time (eng-USA is the same language as en-US, but the code is for a different tier recognizer).
- ASR "All" languages: regardless of language, the most number of simultaneous ports was 25. This value represents a combination of all language rows. It's not the total of their values. Instead, it shows simultaneous calls independent of their language.
- To confirm your understanding, consider this for ASR: the potential value for ALL is between 20 (because the highest value row indicates at least 20 simultaneous ports), and 35 (which is the sum of all rows from the various tiers and languages).
To understand more, see How the system calculates usage statistics.
This report shows the total number of transactions (requests) for recognition and TTS resources in the network for a specified time period. How transactions are counted is based on an algorithm that compares the request duration with an underlying transaction length. A request that fits within this length is a single transaction. A request that surpasses this length can be multiple transactions, depending on the duration of the request.
Note: A recognition request that results in a no match or no input event counts as a transaction.
After you set filters and click Generate, the report appears in the lower part of the same page.
The report divides transaction counts by:
- ASR (language): Shows the total number of transactions (requests) for recognition resources in the network. Also shows highest tier type enabled for recognition.
- TTS (voice): Shows the total number of transactions (requests) for TTS resources in the network. Tier information is not applicable and appears as N/A.
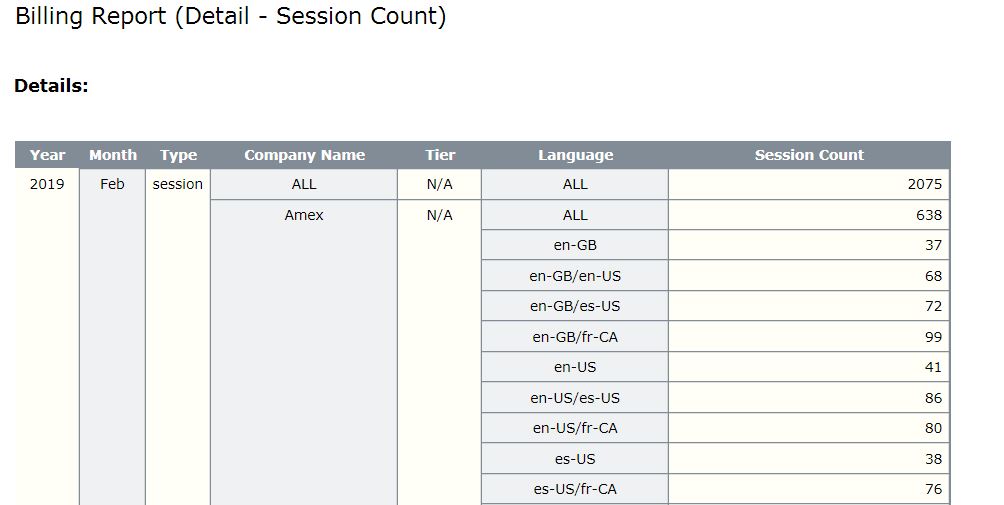
This example shows a detailed Transaction Counts report for the month of February. While the Detailed reports show totals for ASR and TTS usage by company, the Summary reports do not.
![]()
This report shows the total number of sessions (telephone calls) for a specified time period.
After you set filters and click Generate, the report appears in the lower part of the same page.
This example shows a detailed Session Count report for the month of February. (This is a snippet. It shows the top of the report, but not the bottom.)