Getting reports
Note: All sites must generate billing reports and send them to Nuance. Contact your Nuance account manager for details on this procedure. (Exception: sites with perpetual Nuance licenses do not require billing reports. See Turning off billing and capacity monitoring reports.)
The Management Station provides various reports:
- Call analysis reports (System Analysis tab) convert imported call log files and generate statistics on various aspects of a call (such as average call duration and number of tasks completed). Use them to manage deployed systems and ensure optimal system performance. See Generating call analysis reports.
- System performance reports (System Analysis tab) provide statistics on vital aspects of system performance (such as CPU utilization, memory use). For example, use them to examine resource consumption or response times and determine if enough resources are provisioned to handle current volumes of call traffic. See Generating system performance reports.
- Task manager reports (System Analysis tab) summarize running and scheduled tasks.
- Capacity monitoring reports (System Analysis tab) show peak port usage, assess system load, and identify trends when the system is too busy or idle. The report shows the maximum number of simultaneous ports used by recognition or TTS resources in the network for a specified time period. These reports are not tied to your license agreement with Nuance. See Generating capacity monitoring reports.
- License Usage reports (System Analysis tab) show recent license checkouts by application and service. Use these reports to assess activity related to your license agreement with Nuance.
- Capacity Management reports (System Analysis tab) summary percentages of licenses used application and service. Use these reports to assess whether you're paying for more licenses than needed, or if your application performance suffers while waiting for licenses to become available.
- Billing reports (available on the Billings tab) show the runtime use of Speech Suite features as allowed by your license agreement with Nuance. See Generating billing reports.
How the system collects statistics
The statistics collector service gathers call statistics for use in billing and capacity purposes.
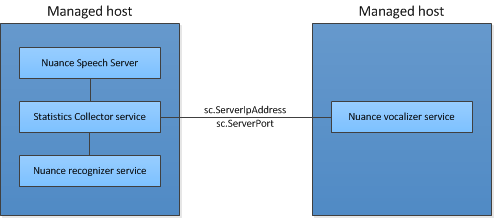
Using the client-server model as an analogy, the statistics collector service, acting as the server, collects data from services or clients that produce statistics:
- Nuance recognition service
- Nuance Speech Server
- Nuance vocalizer service
- Natural Language Processing service
By default, the statistics collector service is included in all roles that include these clients and also runs on the same host as the clients. To set up a deployment where this service is not running on the same host as a client that produces statistics, you must set sc.ServerIpAddress and sc.ServerPort on the client to identify the host and port where the statistics collector service is running. The default IP address is 127.0.01. The default port is 9779.
For example:
Management Station generates reports using summarized data, which takes up far less disk space than raw data. It transforms raw statistics into sums and stores the results in different database tables. Data summarization is transparent, occurring automatically every hour.
By default, Management Station is configured to delete raw data older than 13 months and summary data older than 1095 days (three years). Purging the raw data is not configurable. If you need to change the purge schedule for summary data, contact Nuance Network at Nuance Network.
How the system optimizes reports with summarization
For call analysis reports and system performance reports, Management Station has a built-in data summarization feature that periodically transforms imported call log data into hourly sums and stores the results in different database tables. Management Station generates call analysis reports using summarized call log data. The results are exactly the same as generating reports with detailed call log data.
With summarized data:
- Report generation is very fast. The time needed to generate a report is proportional to the amount of data queried. A report that might take an hour with detailed records takes just a few seconds with summarized records.
- Summarized data takes up far less disk space than detailed data.
- CPU and disk consumption are minimal.
Data summarization is transparent, occurring automatically under these conditions to ensure data integrity and completeness:
- Right before applying report filters to generate a call analysis report on demand
- Right before generating a scheduled report
- Right after importing call log files
- Right before purging detailed call log files
1 GB of free disk space is required for data summarization. If the free disk space on Management Station falls below this threshold, an alarm is raised. You will need to free more disk space.
How the system calculates usage statistics
Diagrams and explanations showing how the system calculates minutes and peak port usage during a call:
This diagram shows how ASR and TTS sessions are used to calculate total minutes and peak port usage. A single call may have several sessions.
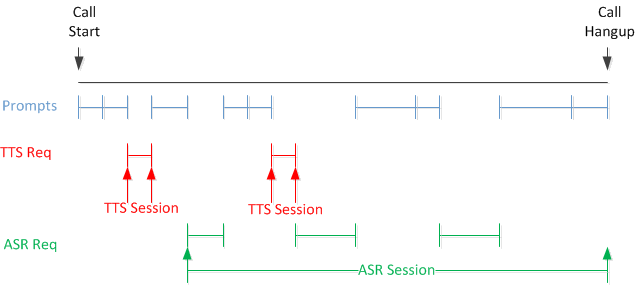
- During a call, there can be one or more requests for ASR and TTS resources.
- Most commercial voice browsers request an ASR resource the first time recognition is required, which may or may not coincide with the start of the call.
- The ASR session starts when the resource is requested and ends when the call ends. So there can be only one ASR session in a single call.
- For minutes usage, only the duration of the ASR session is counted, not the sum of the ASR requests.
- For peak port usage, the number of simultaneous ASR sessions are counted.
- Most commercial voice browsers request a TTS resource whenever text-to-speech synthesis is required. However, there may be some cases where the TTS session is created at the first request for a resource and ends only when the call ends.
- For most voice browsers, each TTS session in a call starts when the TTS resource is requested and ends when the TTS resource is released, usually right after the synthesized audio is played. So there can be many TTS requests and TTS sessions in one call.
For some voice browsers, there is only one TTS session in a single call.
- Most voice browsers—For minutes usage, the duration of the synthesized text for all TTS requests are counted, not the sum of the TTS sessions durations (though usually these are the same).
Some voice browsers—For minutes usage, only the duration of the single TTS session is counted, not the sum of the TTS requests.
- For peak port usage, the number of simultaneous TTS sessions are counted.
- Most voice browsers—For minutes usage, the duration of the synthesized text for all TTS requests are counted, not the sum of the TTS sessions durations (though usually these are the same).
This diagram shows how simultaneous port usage is calculated. Each call corresponds to a port in use. Simultaneous port usage occurs when ASR or TTS sessions overlap. For simplicity, only ASR sessions are shown as there is only one per call.
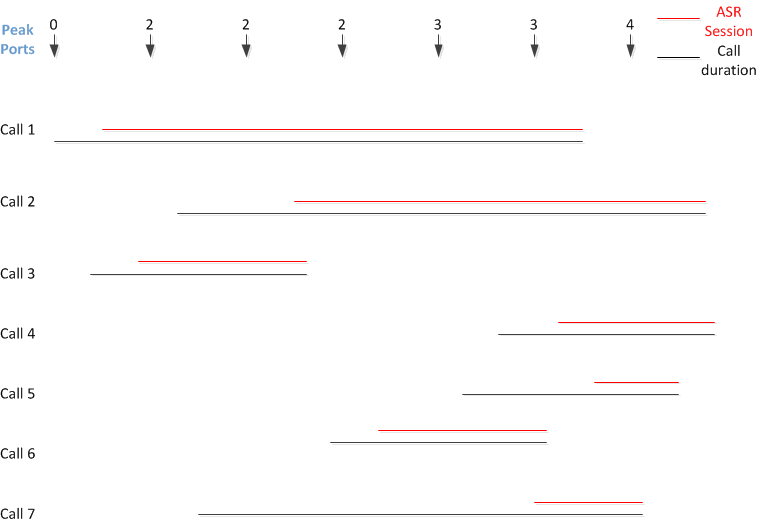
- The top row, Peak Ports, shows a moment in time. The ASR session starts at the first request for a recognition resource and doesn’t necessarily coincide with the start of the call.
- To understand the results in the diagram, choose a time-segment column and scan down and count the ASR sessions. Any sessions that overlap show simultaneous port usage.
For example:
- At the first time segment, there are no ASR sessions yet. The calls have started but there hasn’t been a request for a recognition resource.
- At the second time segment, there are two overlapping ASR sessions so the peak port count is 2.
- At the last time segment, there are four overlapping ASR sessions so the peak port count is 4.
This diagrams shows how multilingual usage is calculated. For simplicity, only ASR sessions are shown.
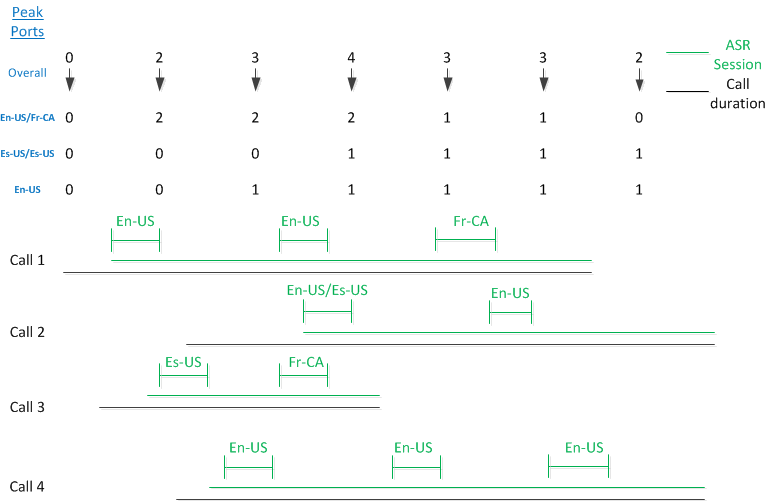
- The ASR session is considered multilingual if any ASR requests in a call use multiple languages.
- For a given ASR session, the individual language sessions are combined into a single language combination, which is applied to the entire ASR session. Looking at the diagram:
- Call1 = En-US/Fr-CA
- Call 2 = En-US/Es-US
- Call 3 = En-US/Fr-CA
- Call 4 = En-US (there is no combination as only one language is used)
- The top row, Peak Ports, shows moments in time. To understand these results, you can choose a time-segment column, scan down, and count the ASR sessions to get the overall peak port counts. Count the language combinations for the overlapping ASR sessions. This gives the language count.
For example:
- At the first time segment, there are no ASR sessions yet. The calls have started but there hasn’t been a request for a recognition resource.
- At the second time segment, the ASR sessions for Call #1 and Call #3 overlap. The overall peak port count at this moment in time is 2, and since both these calls involve En-US/Fr-CA language combination, the peak port for that language combination is also 2.
- At the third time segment, the ASR sessions for Call #1 and #3 are still in progress, but now Call #4 comes into play. The overall peak port count at this moment in time is now 3, with the language combination breakdown being En-US/Fr-CA = 2 and En-US = 1.
