Generating call analysis reports
Call analysis reports (System Analysis tab) convert imported call log files and generate statistics on various aspects of a call (such as average call duration and number of tasks completed). Use them to manage deployed systems and ensure optimal system performance.
To enable call analysis reports, you must import logs. See Importing call log files.
Example uses for these reports:
- Service providers can see how often a particular application is accessed.
- Call center managers can determine the amount of call traffic, the busiest call time, and the average call duration. This last statistic is especially important. Too high a value could mean that the application is confusing or difficult for the caller. Extended calls tie up telephony ports longer and incur more costs.
- Speech specialists, to see the number of recognitions, rejections, and aborts for specific dialog states. These reports show how well an application is performing and highlight potential problem areas.
| Report | Description |
|---|---|
|
Overview |
This chart gives you a quick glance at the total call volume for all call logs imported into the database. You can view this information by different time blocks: by hour, day, week, month, year. |
|
Call Volume |
This report shows the total amount of call traffic, the average call duration, and the time of the busiest call traffic. |
|
Voice Site Hit |
This report shows the dialog states that were accessed (“hit”) in an application, and the number of times each was accessed. Service providers can use this report to compare the call volume between applications. For example, if most callers access the weather application, but not the horoscope application, you could eliminate what seems to be an unpopular service and save costs. |
|
Hotspot |
This report is geared for speech specialists interested in analyzing and tuning the performance of a speech-recognition application. Among other things, the hotspot report includes information on the accumulated number of recognitions, rejections, and aborts for specific dialog states in a VoiceXML application. By analyzing these statistics, you can determine which VoiceXML dialog states show poor recognition performance and require more investigation. |
|
Task Completion |
This report shows, among other things, the number of successful and unsuccessful results for a particular task and the reasons why. A task represents a unit of work coded in a VoiceXML application, for example, placing a order, transferring funds, requesting a phone number, and so on. Note: This report is only relevant users of the Nuance Voice browser service, and only when your VoiceXML application uses the <nuance:taskbegin> and <nuance:taskend> tags to define the start and end of tasks. For details, see the Nuance Voice Platform for Speech Suite 11 documentation. |
|
Task Duration |
This report shows the number of times a task completed, along with its average and maximum duration |
General steps for generating reports
To generate reports:
- Click the System Analysis tab.
- Click Call Analysis. A default Overview chart appears summarizing the total call volume for all call logs imported into the database. (If nothing appears, go to Data Management and import the data.)
- Click a report type in the left frame.
- Specify filters to select the data you want to show in the report.
Filtering reports
All call analysis reports contain several filter fields in common. For example:
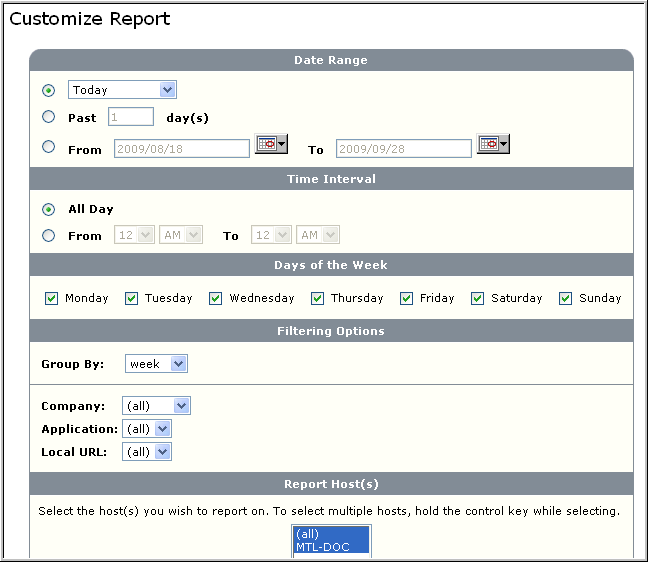
- Date Range: Enter the number of days or specify a particular date interval.
The Today field provides a shortcut for specifying a block of time, for example, the current or last month, the past 90 days, and so on.
The Past day(s) field lets you specify your own block of time, for example, 2 days or 14 days. The number of days includes the current day. For example, Past 1 day would be today, starting from the current time back to midnight.
Note: It is possible that you may get less than one day’s worth of data in your report, depending on what time it runs. As a workaround, schedule the report to run at 2 or 3 a.m. and select Past 2 day(s). You’ll get all of yesterday’s data, plus a little bit of the early morning.
The From and To fields are the dates when the call sessions were recorded. Click the calendar icon to select the dates. Note that the Management Station detects the date of the first and last call sessions stored in the database and displays these as the default values.
- Time Interval: Select All Day or select From and choose a specific time interval. The smallest time increment is an hour.
The interval is for each day specified in the date range. For example, if you specify a date range from February 14 to 20, and a time interval from 10 a.m to 6 p.m, then the generated report shows all calls from 10 a.m to 6 p.m on February 14, from 10 a.m to 6 p.m on February 15, and so on. The Management Station displays an error message if you enter an invalid time range.
- Days of the Week: Uncheck any day that doesn’t interest you. For example, if you want the report based on data only for Monday through Friday, then uncheck Saturday and Sunday.
- Filtering Options: Choose a particular company and application from the list, if desired. On most reports, you can also choose the local URL for the selected application. This value identifies the telephone number or sip address used to execute that application.
The Tenant(s) filter appears if a tenant ID field is included in the call log file (meaning it was coded in the application). This filter lets you create a report based on a particular tenant. In a hosted environment, a tenant is a client of a service provider for whom the application has been customized.
Choose a particular tenant from the list. Choose (all) to include all tenants, otherwise, accept the (default) to not filter by tenant.
For example:
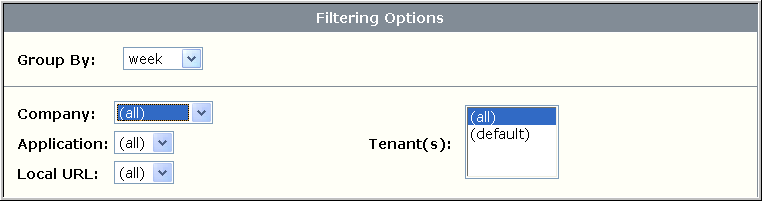
The values you select from these options appear as headers in the generated report.
- Group By: Some reports have a Group By option for setting time intervals along the x-axis. For example, in the Call Volume report, each bar in the chart can represent the total number of calls in an hour, a day, a week, a month, or a year.
If you’re interested in detecting trends over time, then you would choose a larger interval like month or year.
The combination of Time Interval and Group By affect the units displayed on the x-axis. For example, if you specified a time interval from 6 AM to 12 PM and grouped by hour, the x-axis would be divided in hours from 6 a.m. to noon.
- Report Host(s): You can generate reports on call log files imported from specific hosts. Choose the host(s) you want to report on. You can also filter on specific clusters or choose all to select all hosts and clusters. What you select appears in the report heading.
Note: Do not use this filter for merged call log files. Use Report Group(s) instead.
- Report Group(s): If you’ve performed a log merge operation, you must generate reports by group. Choose the group(s) you want to report on, then select (All) for Report Host(s). The generated report will show only the hosts in the selected group(s).
Each report type also has specific fields for additional filtering. See the topics that follow for more specific information including sample reports.
Detailed steps for generating reports
Below are more detailed steps for generating each of the reports available.
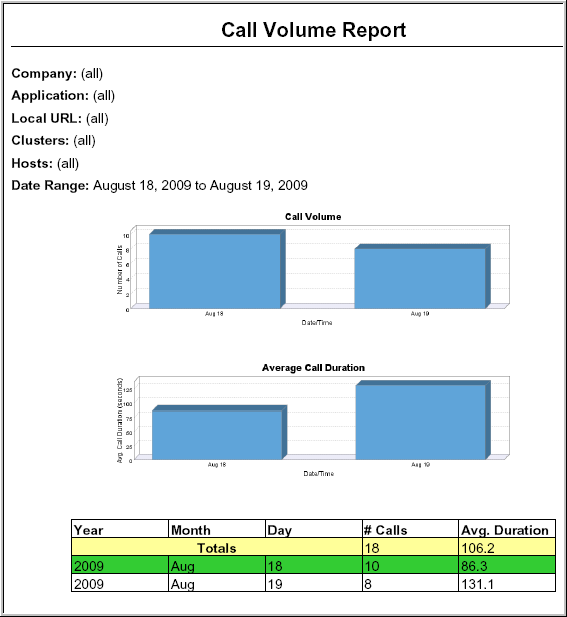
The Call Volume report charts the number of calls and average call duration over time for a particular customer and application (if specified). It also provides a details table showing a breakdown of the information.
- Click Call Volume Report in the left frame. A chart appears summarizing the total number of calls for all call log files in the database.
- Change the Group By: field and click Refresh, or scroll down and specify additional filters to select data that interests you.
- Generate the report, either immediately or for a later time.
- If you choose to generate the report immediately, the report appears in a new window, showing a Call Volume chart, an Average Call Duration chart, and a Details table with the busiest-hours rows highlighted. For example (printer-friendly version in PDF format):
Example
Let’s say you’re interested in seeing the amount of call traffic for each hour during the midnight to 6 a.m. shift. You want to generate a report every Monday morning that charts the data for the previous week. This scenario assumes that you have scheduled to import call log files as a recurring task every night at 2 a.m. (Scheduling the data import is beyond the scope of this example. See Scheduling and managing tasks for another scenario where this is shown.)
Customize the Call Volume report as follows:
- For the date range, select Past and enter 7 for the number of days. The report will be generated on data starting from the current day and back.
- Specifying a “past” number of days ensures that the report is always generated on new data.
- Keep all days of the week checked.
- For the time interval, specify from 12 AM to 6 AM.
- Group by hour.
- Accept the remaining defaults.
- Click Schedule Report. The Task Recurrence page appears:
- Since you want the report to show Monday through Sunday, select the next Sunday for the start date. Make sure to specify a time after the time you’ve scheduled for the daily data import, say 4 a.m.
- Select a weekly recurrence.
- Click Schedule. The Task Manager page appears showing your scheduled report. Once the scheduled start time expires, the report executes, and the next scheduled occurrence automatically appears.
From now on, a weekly report will be generated every Sunday, reflecting data accumulated over the past seven days.
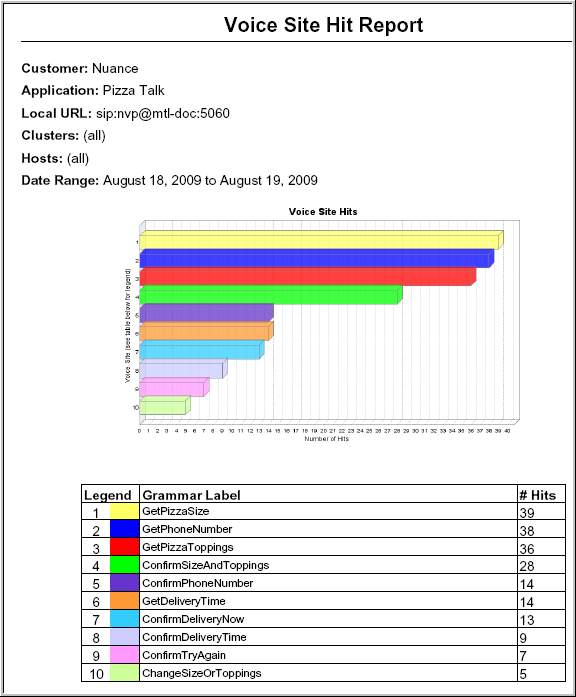
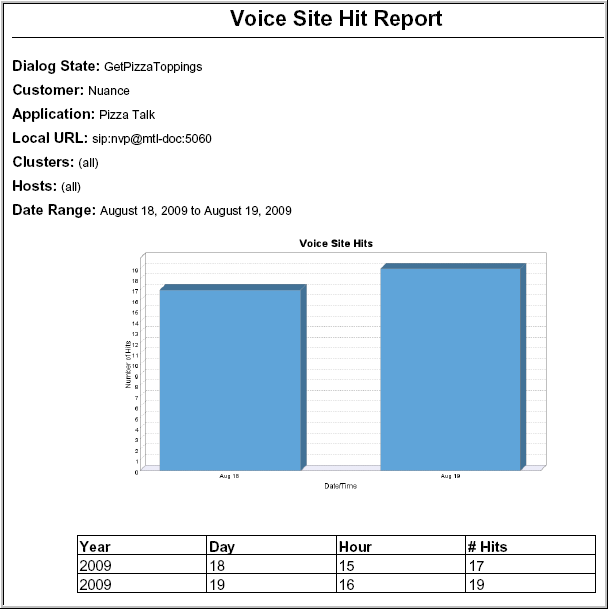
The Voice Site Hit report shows how often a dialog state was accessed over time for a particular company and application (if specified). This report is useful for analyzing web-site call traffic among applications.
Generating this report requires that you code grammar labels in your application. A grammar label is a unique identifier for the grammar associated with each dialog state. See your Nuance speech products documentation to learn about coding these labels.
- Click Voice Site Hit Report in the left frame.
- Specify the filters to select data that interests you. For example, change the Number of Dialog States to Show value, if desired.
- Generate the report, either immediately or for a later time.
- If you choose to generate the report immediately, the report appears in a new window, showing:
- A bar chart with the number of hits for the number of dialog states specified.
- A details table identifying the specific grammar label accessed and number of hits for each.
For example, a report might look like this:
- Click any grammar label. A new chart and details table appear showing a breakdown of the number of hits for that particular dialog state and when they occurred.
- You can change the Group By field on this page, if desired. For example, the report grouped by day might look like this:
The Hotspot report shows the status of the recognition operation for selected dialog states in a VoiceXML application. For example, you can see the number of recognitions, rejections, aborts, and so on.
Generating this report requires that you provide grammar labels in your application code. A grammar label is a unique (and more meaningful) identifier for the grammar associated with each dialog state. The default is simply the grammar name, but you can add any number of grammar labels in your application.
- Click Hotspot Report in the left frame.
- Specify the filters to select data that interests you.
- Click Next. A list of dialog states appears. The dialog-state name identifies the specific grammar label accessed. For example:
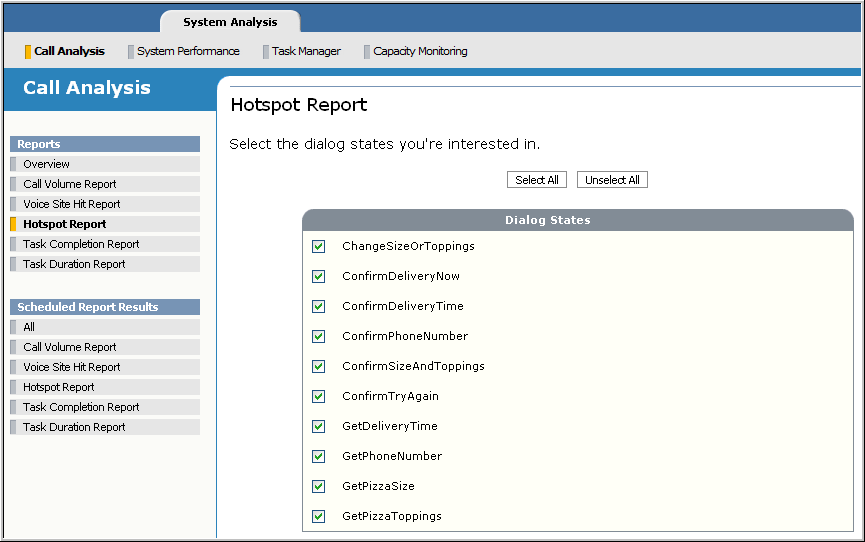
- Select the dialog states that you want to analyze.
- Generate the report, either immediately or for a later time.
Note: Nuance recommends scheduling the report for off-peak hours when system use is low. Generating these reports on demand isn’t advisable because they can be performance-intensive and place demands on the system.
- If you choose to generate the report immediately, the report appears in a new window, showing a Hotspot activity chart (percentage of recognitions and rejections for each dialog state), followed by a Details table of information for each dialog state. For example:
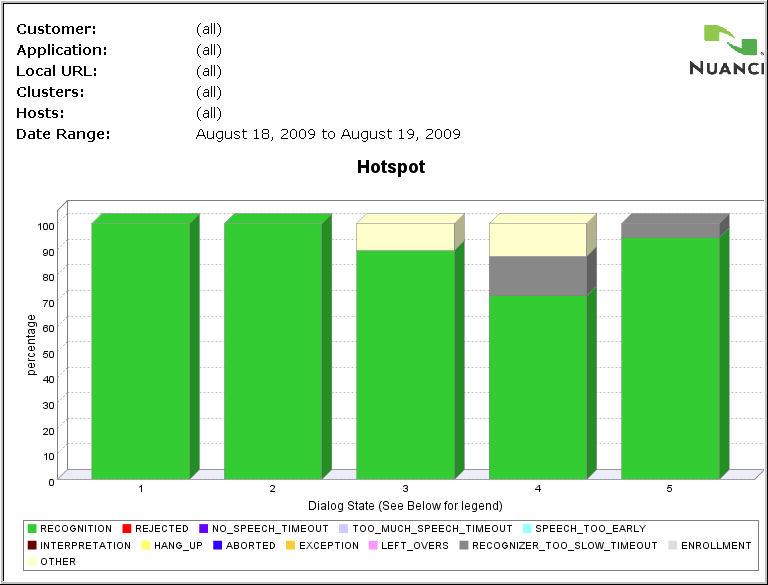
The possible values in the Details table:
- Recognition—A successful recognition.
- Rejection—An unsuccessful recognition.
- Too Much Speech—Recognition aborted due to a too much speech timeout. Not applicable.
- Speech Too Early—The recognition aborted due to speech spoken too early. Not applicable.
- Interpretation—Not applicable.
- Hang up—The recognition aborted because the caller hung up.
- Aborted—The recognition aborted.
- Exception—The recognition aborted due to an exception.
- Left overs—Some information was recorded after the call completed. Not applicable.
- Recognizer Too Slow Timeout—The recognition aborted due to a slow response from the Recognizer. This includes when recognition is aborted because no speech was detected.
- Enrollment—A successful voice-enrollment record. Not applicable.
- Other—Value does not fall into any other category.
- If you choose to generate the report immediately, the report appears in a new window, showing a Hotspot activity chart (percentage of recognitions and rejections for each dialog state), followed by a Details table of information for each dialog state. For example:
Note: This report is only relevant users of the Nuance Voice browser service, and only when your VoiceXML application uses the <nuance:taskbegin> and <nuance:taskend> tags to define the start and end of tasks. For details, see the Nuance Voice Platform for Speech Suite 11 documentation.
The Task Completion report shows the number of successful, failed, unknown, and incomplete task results for a particular task. For successes and failures, the report provides reasons and details why. To generate this report, tasks must be coded in your VoiceXML applications.
A task is a unit of work, for example, accessing a bank account, selling an item, obtaining a telephone listing. Each task has a beginning and an end, a name, reasons with results (success, failure, unknown), and where appropriate, details about specific reasons.
From an application perspective:
- Attempted tasks encompass everything—completed and incomplete tasks results
- Completed tasks are those that reached the end of the task and include successes, failures, and unknowns:
- Successful task results are those reasons labeled success in the application
- Failed task results are those reasons labeled failure in the application
- Unknown task results are reasons that don’t fall into either category
- Incomplete task results are those that never reached the end of the task
For example, say the task is to access your bank account. The application asks for your name and PIN. If you provide the correct information, you’ll get into your account (successful task result, reason is “valid PIN”). If you give the wrong PIN, the application denies you access (failed task result, reason is “invalid PIN”, detail is “Maximum attempts exceeded”). If a system error occurs, for example, the system dropped the call, then the application never reaches the end of the task. This is identified as an incomplete task result.
This report also charts the ratio of successfully completed task results to total task attempts over time. These results are reasons that you have decided count as successful. By default, the application determines these for you by displaying all reasons labeled success. However, you make the final decision and can choose other reasons to filter on when generating the report.
Finally, the report calculates a return on investment (ROI). By entering an ROI multiplier, you can generate the total benefit to your company for successfully completed tasks over a given time period.
The following instructions use a sample directory-assistance application. The procedure is the same regardless of the application you’re running.
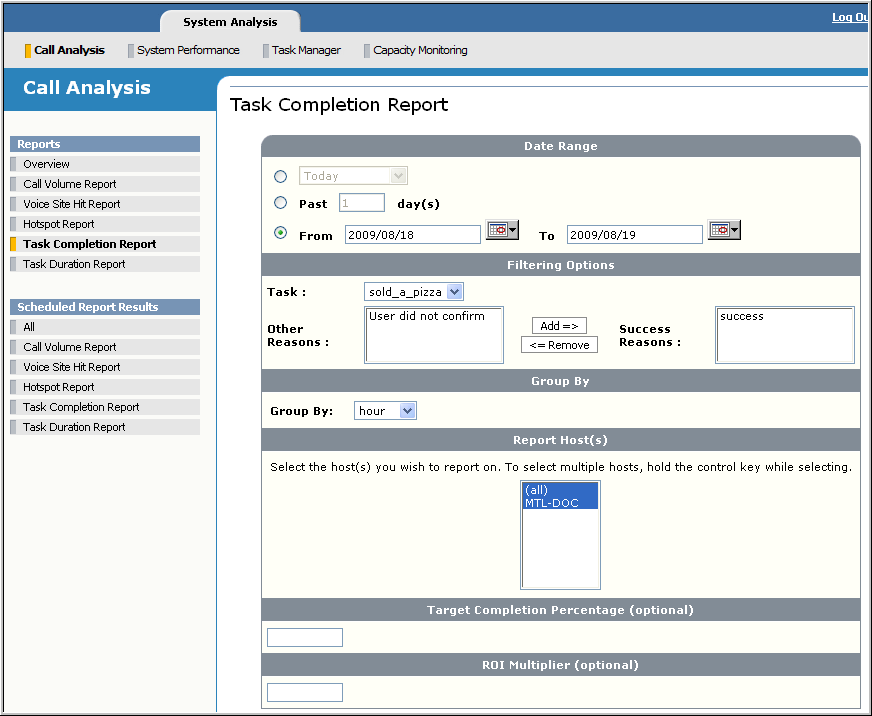
- Click Task Completion Report in the left frame. The Task Completion Report page appears where you specify filters to select data that interests you:
Where:
- Date Range: Enter the number of days or specify a particular date and time interval. The value represents when the calls were recorded.
The Today field provides a shortcut for specifying a block of time, for example, the past 30 or 90 days.
The Past day(s) field lets you specify your own block of time, for example, 2 days or 14 days. The number of days includes the current day. For example, Past 1 day would be today.
Note: It is possible that you may get less than one day’s worth of data in your report, depending on the what time it runs. To avoid this situation, schedule the report to run at 2 or 3 a.m. and select Past 2 day(s). You’ll get all of yesterday’s data, plus a little bit of the early morning.
The From and To fields let you specify larger time intervals. Select the option, then click the calendar icon to select a date and time. Note that the Management Station detects the date of the first and last call sessions stored in the database and displays these as the default values.
- Tenant(s): This filter appears if a tenant ID field is included in the call log file (meaning it was coded in the application). This filter lets you create a report based on a particular tenant. In a hosted environment, a tenant is a client of a service provider for whom the application has been customized
Choose a particular tenant from the list. Choose (all) to include all tenants, otherwise, accept the (default) to not filter by tenant.
- Task: Choose the task name from the list. These values were coded in the application.
- Other Reasons: By default, this list shows those reasons labeled failure and unknown in the application for the chosen task. Choose the reasons you want counted as successfully completed in the Task Completion Ratio chart and add them to Success Reasons.
- Success Reasons: By default, this list shows those reasons labeled success in the application for the chosen task. Any reason added here will be counted as successfully completed tasks in the Task Completion Ratio chart. Remove any reason you don’t want counted in the calculation.
As you can see, these two fields, Other Reasons and Success Reasons, provide flexibility in what is counted as successfully completed. You can let the application decide (default) or you can decide by picking your own list of reasons.
- Group By: Choose a time interval for displaying the task completion results along the x-axis of the chart.
- Task Completion Percentage (optional): Specify a number indicating a desired success rate. This is an arbitrary value determined by you. The Management Station displays this value as a threshold on the chart to which you can visually compare the actual results.
- Report Host(s): You can generate Task Completion reports on call log files imported from specific hosts. Choose the host(s) you want to report on. You can also filter on specific clusters or choose all to select all hosts and clusters. What you select appears in the report heading.
- ROI Multiplier (optional): Specify a number to calculate the ROI. Enter the number as a string without the $ sign, for example, 1.50 or 3.49. This number multiplied by the total number of what you’ve chosen as successfully completed task reasons gives the ROI, graphed as the total dollar benefit over the specified time interval.
For example, the accounting department in a call center has determined that each automated call (without the intervention of a live agent) saves the company $5.00 per call. You would enter 5.00 in this field. If 10,000 calls were successfully completed over a one-week period, then the ROI for the company is $5.00 x 10,000 for a total of $50,000.
- Date Range: Enter the number of days or specify a particular date and time interval. The value represents when the calls were recorded.
- Generate the report, either immediately or for a later time.
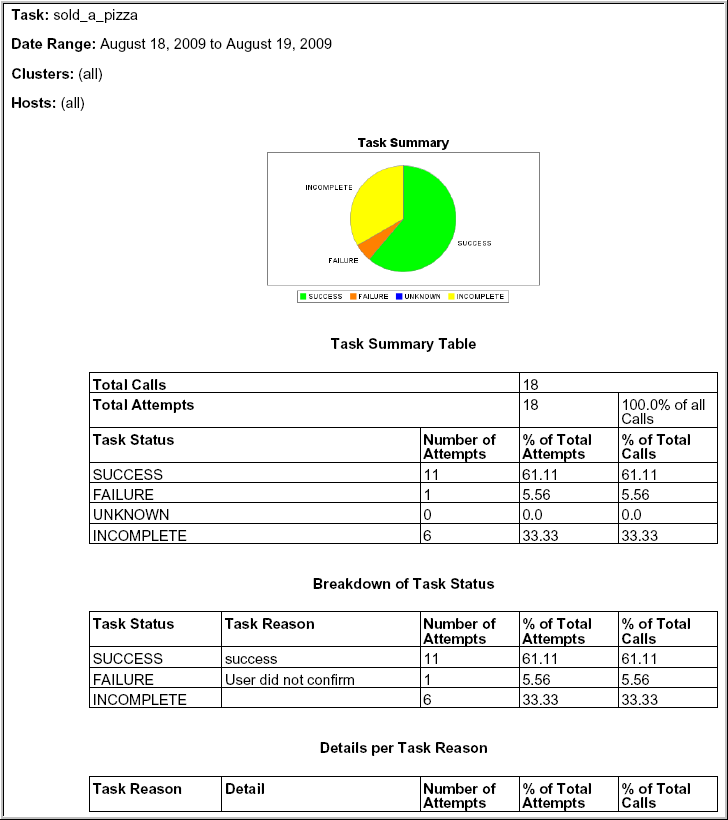
- If you choose to generate the report immediately, the report appears in a new window, showing:
- Task Summary pie chart potentially divided into four task-status regions:
Success
Task reasons labeled success in the application
Failure
Task reasons labeled failure in the application
Unknown
Task reasons not falling into either category
Incomplete
Failed to reach task end
- Task Summary table showing statistics like total calls received, total task attempts, the number of successes, failures, unknowns, and incompletes. Note that total number of attempts could be greater than the total calls received. This happens when a caller attempts the same task in the same call.
- Other tables showing a breakdown of the information, for example, the reasons and details for each task status.
- ROI Tracking Chart: A line chart showing the total benefit in dollar amounts for successful tasks. This chart only appears if you specified an ROI Multiplier.
- Task Completion Ratio: A line chart showing the ratio of successfully completed to attempted task results. The success rate threshold appears if you specified a Task Completion Percentage. Completed task results are those reasons you included in the Success Reasons field on the filters page. Attempted task results are all successes, failures, unknowns, and incompletes.
- Details: A table showing a breakdown of the information in the ratio chart.
- Task Summary pie chart potentially divided into four task-status regions:
- Hold the mouse cursor over a region in the pie chart, or place it on any of the points in the pie or line charts to see more information, for example, a total, a timestamp, or a ratio.
Part of a sample Task Completion report might look like this:
The Task Duration report shows the average and maximum duration over a specified period of time for specific tasks. To generate this report, tasks must be coded in your VoiceXML applications. See Generating a Task Completion report.
- Click Task Duration Report in the left frame.
- Specify the filters to select data that interests you. You can select a single task, multiple tasks, or all tasks.
- Generate the report, either immediately or for a later time.
- If you choose to generate the report immediately, the report appears in a new window, showing for each selected task:
- The total number of times that the task completed, that is, how often it reached the end of the task, and include successes, failures, and unknowns.
A 0 value indicates an incomplete task, that is, at no time did it ever reach the end of the task.
- The average amount of time, in seconds, it took for the task to complete, that is, reach task end. Any value less than 500 milliseconds is treated as 0; any value greater than 500 milliseconds is treated as 1. Incomplete tasks appear as NA.
- The maximum amount of time, in seconds, it took for the task to complete. Any value less than 500 milliseconds is treated as 0; any value greater than 500 milliseconds is treated as 1. Incomplete tasks appear as NA.
- The total number of times that the task completed, that is, how often it reached the end of the task, and include successes, failures, and unknowns.
Related topics
Overview
Related tasks
Related topics
