Generating capacity monitoring reports
Capacity monitoring reports (System Analysis tab) show peak port usage, assess system load, and identify trends when the system is too busy or idle. The report shows the maximum number of simultaneous ports used by recognition or TTS resources in the network for a specified time period. These reports are not tied to your license agreement with Nuance.
Specifying report filters
The results are filtered by application and service: set filters and click Generate. The report appears in the lower part of the same page.
By specifying report filters, you can structure the information to suit your needs. For example, you can compare the peak port usage for an application over the past year or over the past week. You can narrow your focus to see fine details, or you can look at the data more broadly to detect trends.
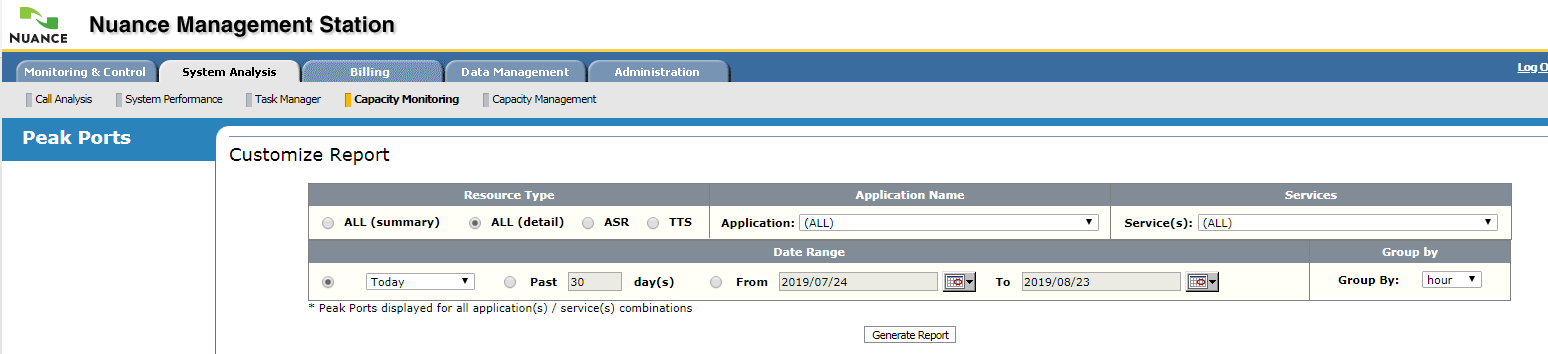
- Resource Type:
- ASR (language): Measures recognition usage. Shows the maximum number of ports used simultaneously by recognition resources for the specified time period. Simultaneous port usage occurs when ASR sessions overlap.
- TTS (voice): Measures text-to-speech usage. Shows the maximum number of ports used simultaneously by TTS resources for the specified time period. Simultaneous port usage occurs when TTS sessions overlap.
- ALL: combines ASR and TTS.
- Application Name: Select an application from the list. These are is defined in your application’s session.xml file. See Configuring application sessions.
- Services: Select All or a specific service. The list depends on the resource type and application. If you selected ASR, only recognition services appear that are used by the specified application. If you selected TTS, only vocalizer services appear that are used by the specified application. Each service includes the name of the host it’s running on, for example, (mt-shepherd-vm3) Nuance recognition service.
- Date range: Enter the number of days or a particular date range.
The first field provides a shortcut for specifying a block of time, for example, the current or last month, the past 90 days, and so on. The default is Today.
The Past day(s) field lets you specify your own block of time, for example, 2 days or 14 days. The number of days includes the current day. For example, Past 1 day would be today, starting from the current time back to midnight.
From/To lets you specify your own time interval. Click the calendar icon to select the dates.
- Group By: Specify the time interval to display along the x-axis:
- Hour: Displays hours on the x-axis up to a maximum of 7 days (includes current day).
- Day: Displays days on the x-axis up to a maximum of the past 3 months (includes current month).
- Week: Displays weeks on the x-axis up to a maximum of the past 3 months (includes current month).
- Month: Displays months on the x-axis up to a maximum of the past 3 years (includes current year).
The combination of Date Range and Group By affect the units displayed on the x-axis. For example, if you specified a time interval of past 90 days and grouped by day, the x-axis would be divided in days starting from the current day back 90 days.
Example capacity monitoring report
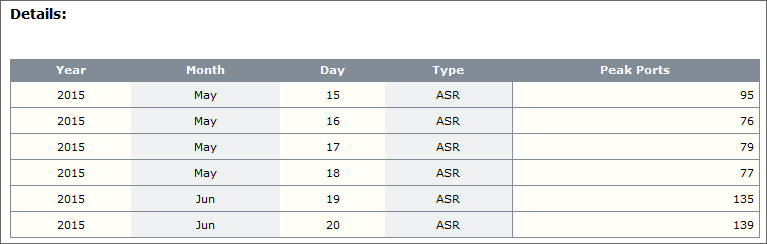
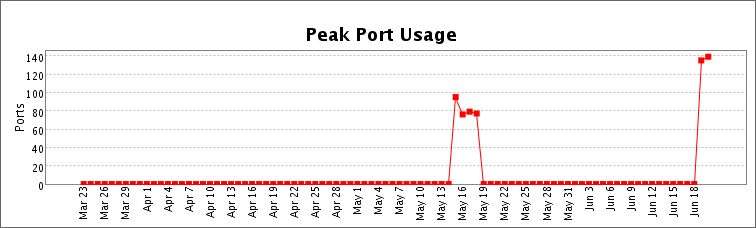
This example shows an ASR Peak Ports Usage report grouped by day for the past 90 days. The top half displays a line graph with the data points. This view helps you spot spikes and trends for further analysis. The detailed part displays the counts. Note that only days with data appear. Empty data points are not displayed. To understand how the results are calculated, see ASR and TTS sessions and Simultaneous port usage.
Line graph:
Details table: