Generating system performance reports
System performance reports (System Analysis tab) provide statistics on vital aspects of system performance (such as CPU utilization, memory use). For example, use them to examine resource consumption or response times and determine if enough resources are provisioned to handle current volumes of call traffic.
You must enable vital signs collection before generating these reports (Data Management→Vital Signs→Collection Configuration). See Managing vital signs.
There are system performance reports:
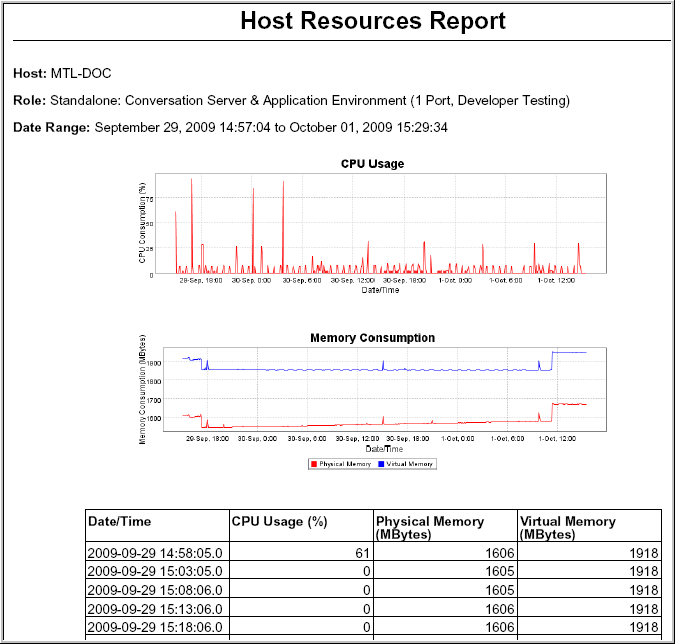
- Host Resources—This report shows the CPU and memory utilization for a specified host.
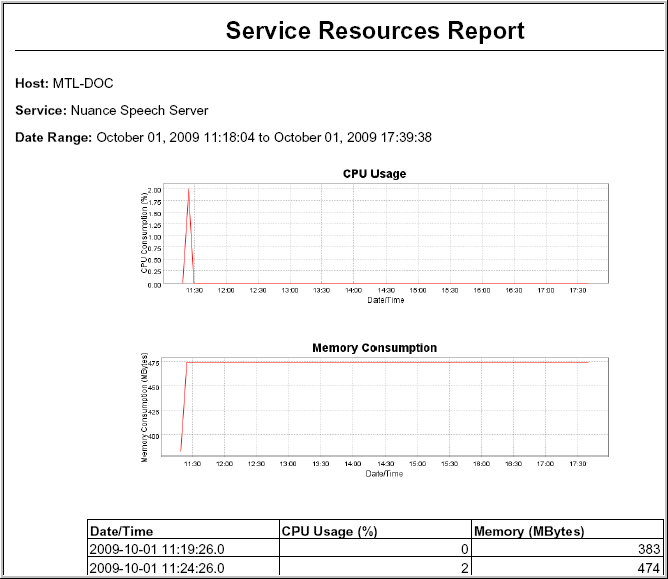
- Service Resources—This report shows the CPU and memory utilization for specified services.
Creating reports
To create a system performance report:
- Click the System Analysis tab.
- Click System Performance.
- Click a report type in the left frame.
Note: You enable vital signs collection before generating these reports (Data Management→Vital Sign→Collection Configuration).
Filtering report results
All system performance reports have several filter fields in common.
- Select the data you want to see in the report:
- Time Range: Specify a number of hours or a particular date and time interval.
The Past hour field specifies a discrete block of time, like the past 1 hour or past 1 week (includes the current day).
The From and To fields specify larger time intervals. Click the calendar icon to select the date and time. The Management Station detects the timestamp of the first and last vital signs stored in the database and displays these as the default values.
- Host (or Service): Choose a host and service (if applicable).
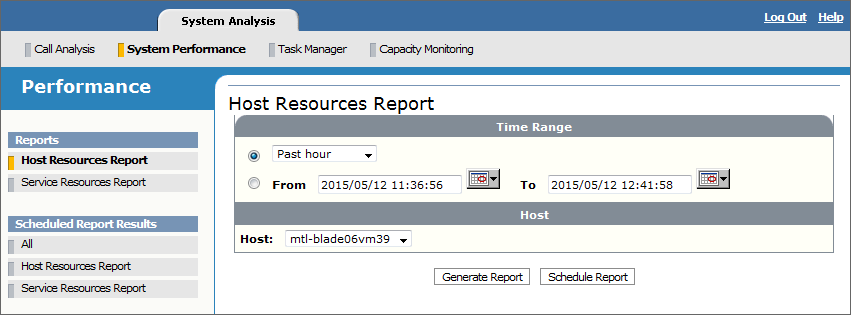
- Time Range: Specify a number of hours or a particular date and time interval.
- Generate the report, either immediately or for a later time. These buttons are disabled if there is no data available to generate a report.
- If you choose to generate the report immediately, the report appears in a new window showing a chart and a details table:
- The chart displays the information based on the filters you specified.
- The details table provides a breakdown of the information in the chart. The rows in the Date/Time column correspond to the collection interval specified on the Collection Configuration page (Data Management→Vital Signs→Collection Configuration). If the collection interval was five minutes, then there will be a row for each five-minute interval.
Examples
Here are a examples of system performance reports. The screenshots are generalized and do not show a specific deployment.
Host Resources report
Service Resources report