KPI Dashboard
This dashboard visualizes KPI trends over time. The intended users of this dashboard are business users who want a high-level summary of program performance KPIs.
-
Before clicking on the MIX Dashboard workbook in Tableau, make sure your browser configuration allows 3rd party cookies.
-
Nuance Insights supports navigating and performing operations with a variety of methods, including a combination of keyboard and mouse, keyboard only, having elements on the screen being audibly described (requires 3rd party software like JAWS), and having voice input interpreted (requires Nuance Dragon). See Accessibility for more information.
In addition to the use of dashboard filters, Nuance Insights allows you to manipulate displayed data through several other means in order to better visualize information. Select from the following to learn more:
Visualizations
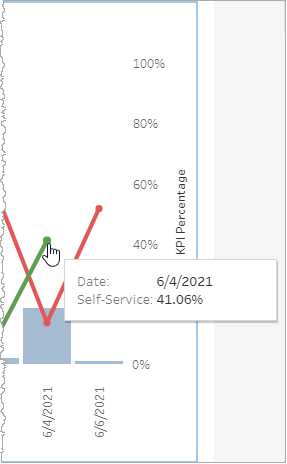
KPI Tiles
You can view the data for each of the KPI tiles either as a series of trending graphs or in a text-only table (in the KPI Statistics tab). Both formats visualize the trend over time of the relative weighting of conversations having a given metric value with respect to the overall number of conversations, split out by a user-configured dimension
Several KPI metrics are individually trended in tiles over the configured time window.
| KPI name | Metric Type | Description |
|---|---|---|
| Total Conversations |
Metric: |
Raw count of the total conversations in the configured time window. |
| Business Intent Collected |
Calculated metric: (Formula: A / B)
|
Percent of users where an intent was collected. |
| Contained |
Calculated metric: (Formula: A / B)
|
Percent of users who are contained in the configured time window. |
| Agent Transfer |
Calculated metric: (Formula: A / B)
|
Percent of users who transfer out to an agent for the given time period. |
| Self Service Completed |
Calculated metric: (Formula: A / B)
|
Percent of users who accomplished one or more self-service functions. |
| Self Service and Contained |
Calculated metric: (Formula: A / B)
|
Percent of users who accomplished one or more self-service functions and were contained. |
| User-specified Exit Reason |
Calculated metric: (Formula: A / B)
|
Ratio of sessions having the selected conversation exit reason compared to the total number of sessions (expressed in percent). Note: User can see tile visualizations for two separate exit reasons. |
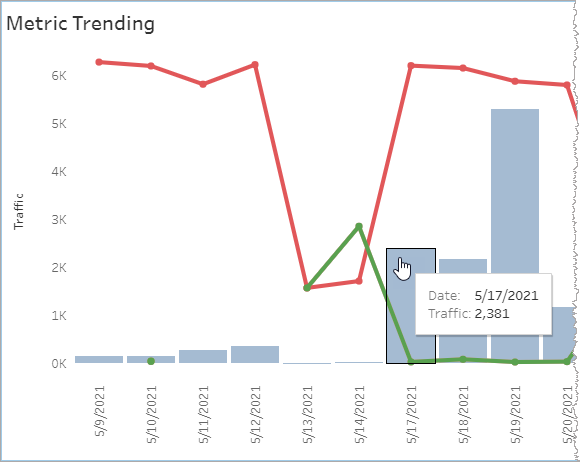
Metric Trending
You can view the data for this section either as a set of overlaid graphs or in a text-only table. Both formats compare key rate-based metrics (namely Self-Service, Agent Transfer and Self Service & Contained) to one another and additionally quantifies traffic volume as a function of time.
The graph visualizes the rate-based KPIs with color-coded trend lines and visualizes traffic volume with a bar chart. The y-axis for the traffic bar chart is on the left side of the graph. The y-axis for the rate-based KPI trend lines is indexed on the right side of the graph. The table lists each KPI quantity in its own column.
Traffic, as measured by raw count, trends over time as a histogram superimposed on the rate-based comparative trend graph. The y-axis for the traffic histogram is on the left side.
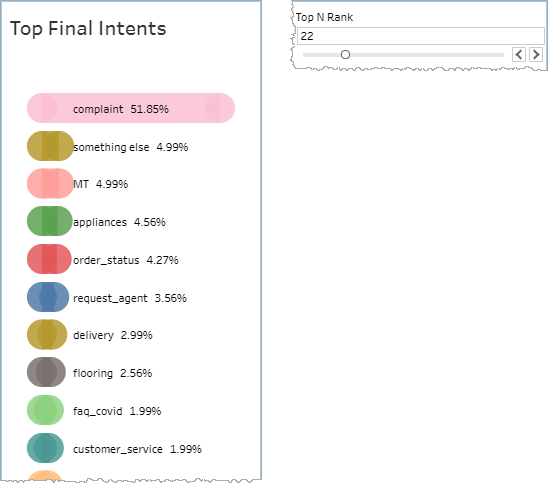
Top Final Intents
This chart compares final intents to one another in terms of the ratio of any one final intent's count to the sum of all counts of all intents in the time window (expressed in percent).
Note: The sum of all displayed percent values may not add up to 100% because the denominator of the calculated ratio is the sum of all counts of all intents while the displayed values only represent the top N rank configured at the top right of the chart.
Use the Top N Rank filter to specify how many of the top final intents you would like to display in the visualization.
Note: The Top N Rank filter is in the top right corner within the Top Intent Trends 30 Days graph.
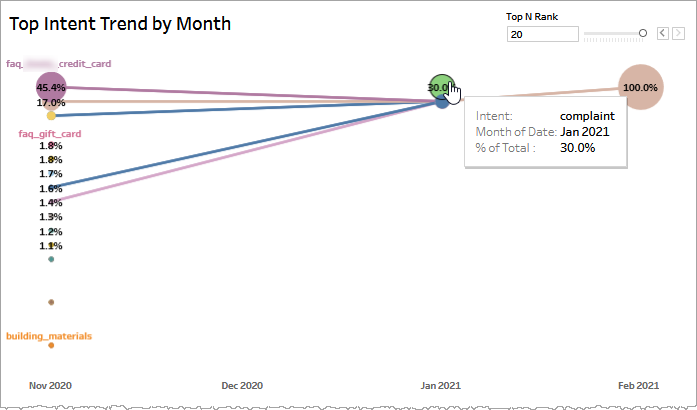
Top Intent Trend by Month
This graph compares the top final intents to one another, trended by month. The vertical position of any one intent relative to the others in the same vertical line visually represents the degree to which that intent is dominant over the other intents at that point in time. As with the Top Final Intents chart, the Top N Rank filter determines the maximum number of top final intents that are displayed.
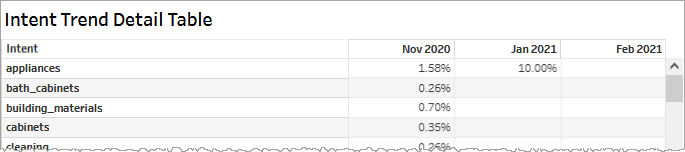
Intent Trend Detail Table
This graph presents the same data from the Top Intent Trend by Month graphic in a tabular format.
Filtering
Filtering selectively reduces the volume of data displayed leaving only information relevant to your purposes.
Clicking Include values displays only those data possessing the selected values. All other data are hidden from the visualization.
By contrast, clicking Exclude values displays only those data that do not possess the selected values.

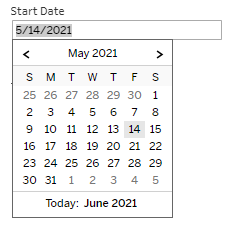
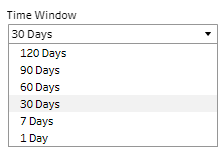
Start Date and Time Window
Use the Start Date calendar widget to specify the date the displayed period begins. Select from the Time Window list to specify only data whose timestamps fall within the configured period. The Time Window setting sets a duration and the Start Date widget specifies when that duration begins.
Channel
Specify one, several or all channels to filter by channel.
By choosing one or more channels from the list, you refine your displayed data-set by including data from only those channels matching the selection.
- Select all available values by selecting All.
- Select only one value by first clearing the All checkbox, and then selecting the value whose data you would like to see visualized.
-
Select several values by doing one of the following:
- Clear the All checkbox, and then select the values whose data you would like to see visualized.
- Select the All checkbox and then clear values whose data you would NOT like to see visualized.
Store ID
Select one, several or all ids to filter by Store ID.
Division
Select one, several or all division codes to filter by Division.
Custom filters
This report accommodates customizable filters.
Customizable filters narrow the scope of the reported dataset by including or excluding data with identifiable attributes. These attributes may be about the session or about an event that may have happened during the session.
For more information about how to add customized filters to your view, contact your Nuance Professional Services representative.
Note: If you would like to modify this or any report, Nuance Communications, Inc. recommends you contact Nuance Professional Services.
