Build Compound Documents
Components for compound documents:
Add multiple charts and reports with Document view
- Use the Insert tab.
- Drag and drop a data source field onto the canvas.
- Double-click a data source field.
- Right-click a data source field.
Tips
- Using the Insert tab, double-clicking a data source field, and right-clicking a data source field all result in a chart or report placeholder being inserted in the top-left corner of the canvas.
- Dragging and dropping a data source field onto the canvas inserts the place holder at the location you dropped the data source field.
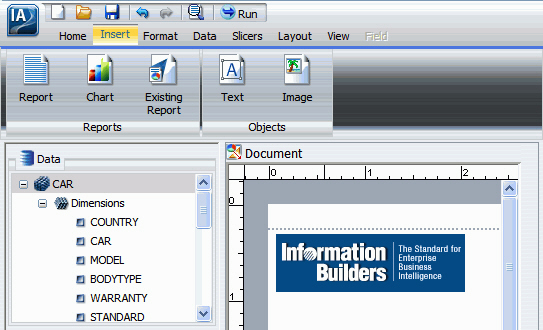
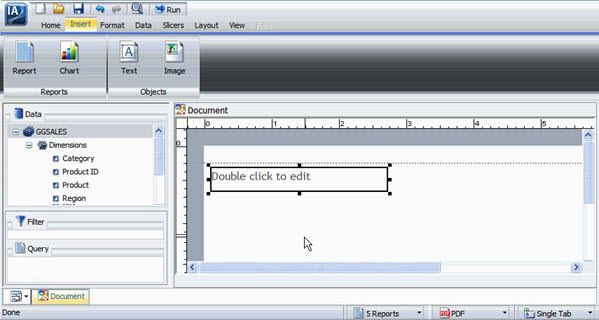
Insert a chart or report with the Insert tab
Inserting charts and reports with The Insert tab is unique to Document view.
- In Document view, from the Insert tab, Reports group, select Chart or Report. (A placeholder displays in the top-left corner of the canvas.)
- Add data source fields to the chart or report using the canvas and The Resources panel.
Insert a chart or report with drag and drop
- From the Format tab, Destination group, or the Home tab, Format group, select Chart or Report.
- Select a data source field from the Data pane in the Resources Panel and drag it onto the Layout Canvas.
- Drop the data source field onto an open area of the canvas and NOT on top of another chart or report.
- A placeholder with the selected data source displays in the Results panel.
- You can now add fields to the chart or report using the canvas and The Resources Panel.
|
Chart placeholder
|
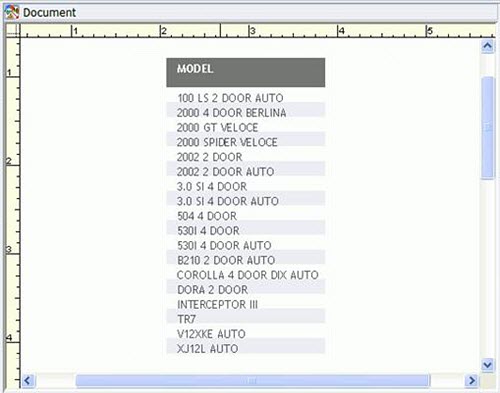
Report placeholder
|
Insert a chart or report with double-click
To insert a chart or report with double-click, make sure that no chart or report is actively selected on the canvas.
- From the Format tab, Destination group, or the Home tab, Format group, select Chart or Report.
- Double-click a data source field in the Data pane of the Resources Panel. A placeholder with the selected data source displays in the Results panel
- Add fields to the chart or report using the canvas and The Resources Panel.
Note: You cannot insert a new chart or report with a double-click if a report is actively selected. If a report is selected, click the canvas to deselect the report and make the canvas the active object.
Insert a chart or report with right-click
To insert a chart or report with right-click, make sure that no chart or report is actively selected on the canvas.
- From the Format tab, Destination group, or the Home tab, Format group, select Chart or Report.
- Right-click a data source field in the Data pane of the Resources Panel.
Note: You cannot insert a new chart or report with a right-click if a report is actively selected. If a report is selected, click the canvas to deselect the report and make the canvas the active object.
For Charts, select from the available right-click options.
- Include as Measure - For measure (numeric) fields.
- Include as Category Axis - For dimension (non-numeric or date) fields.
- Include as Legend Series - For dimension (non-numeric or date) fields.
- Filter - For all types of fields
- Coordinated - The Coordinated field container contains a common sort field for creating multiple reports and graphs that are burst into separate page layouts. Each value for a coordinated sort field displays on a separate page.
|
|
Reports menu
|
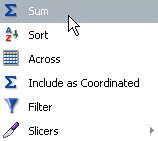
For Reports, select from the available right-click options.
- Sum
- Sort
- Across
- Include as Coordinated
- Filter
- Slicers (not currently available)
A placeholder with the selected data source displays in the Results panel.
- The chart placeholder turns into a live preview of the chart when both X-axis and Y-axis data fields are selected.
You can now Add Data Source Fields to the chart or report using the canvas and the Resources Panel.
Insert an existing report
In Document view, insert existing charts and reports onto the canvas.
- From the Insert tab, Reports group, select Existing Report. You cannot use other Custom Report items as components.
- Browse to the report you want to insert and click OK.
Note: You cannot edit an existing report that is inserted into a compound document.
Insert text
- In Document view and from the Insert tab, Objects group, select Text.
- Double-click or right-click the text component to Edit and Format Text.
Note: Inserting text and images is a feature unique to Document view and is not an option in Interactive Design or Query Design view.
Inserting a text placeholder
Insert images
|
|
Inserted image
|