Building Checkpoint Tree reports
Understanding checkpoints
Checkpoints indicate points that a customer has reached in a script. They are flags defined in your application like mileposts along the freeway. When the customer encounters a checkpoint, the application makes note of it. The "final" checkpoint is the most recent checkpoint that the customer encountered before the call ended.
Checkpoints are unique to each application, although there are standard points that almost all applications define as checkpoints. You can analyze the checkpoint statistics to identify potential areas of application improvement.
If a large percentage of customers unexpectedly hang up at a particular point in the call flow, this section of the call becomes a prime candidate for evaluation and fine tuning.
Understanding Checkpoint Tree reports
Use the checkpoint tree report to review how alert types perform at different checkpoints and determine where problems are occurring.
The report displays a tree diagram showing each checkpoint that was reached for the selected alert type, date range, report type, and domain. The root of the tree is the selected alert type. The associated result codes are shown as child nodes of the root. The checkpoints are arranged in a tree structure that reflects the paths taken by attempts captured in the report. The structure of a simple checkpoint tree with one checkpoint is shown here:
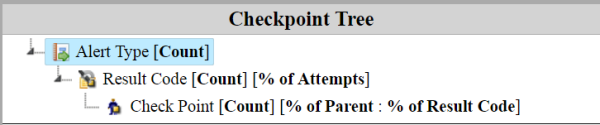
As you can see, the Alert Type is the root, the Result Code is the child node, and the Checkpoint is the child of the Result Code. The report displays an attempt count for all nodes. For result codes, both an attempt count and a percentage is displayed. For checkpoint nodes, an attempt count is shown, along with two percentages: the percentage of parent attempts that reached this checkpoint and the percentage of result code attempts that reached this checkpoint.
See also:
To build the report:
- In the header, click Reports.
- In the left nav bar, click Summary > Checkpoint Tree. You should see the Checkpoint Tree Report query screen.
- Under Date Range, select Alerts Sent Between or Alerts Received Between.
- Enter a Date Range. Data is available for up to the past 13 months, but report query spans must be 31 days or less.
- Select a Reporting Domain. The options are defined by your application.
- Select the Alert Type.
- Select the Report Type: Latest Attempt or All Attempts.
- Select the Type of Data: Production Data or Test Data.
- Click Run Report.
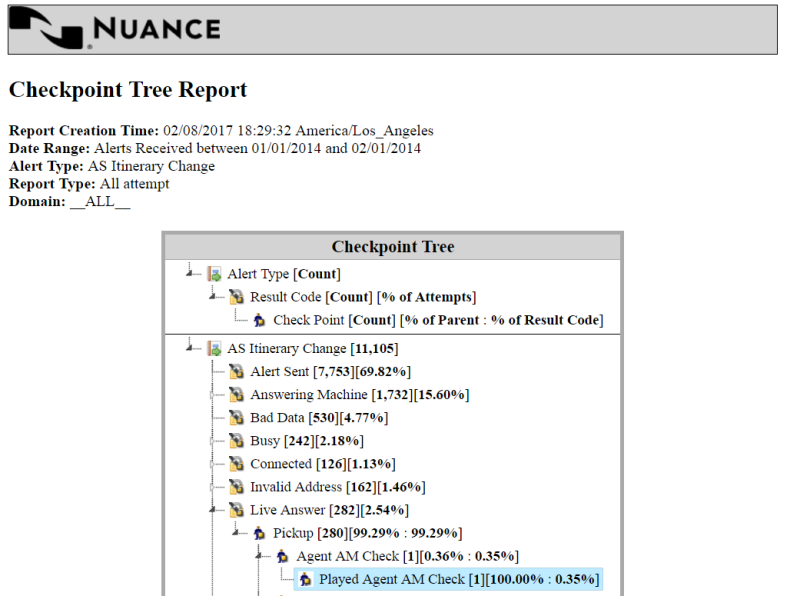
Here is an example Checkpoint Tree report for a voice alert. Only part of the tree is shown. Note the tree structure and the counts displayed for the checkpoints under the Live Answer result code. Only one attempt reached the highlighted checkpoint "Played Agent AM Check". The child nodes for other results, such as Busy and Connected, are collapsed in this view and not visible.