Building Checkpoints Reports
Checkpoints reports show the percentage of successful contacts that reached each checkpoint. You can build the following Checkpoints reports:
- Pie Charts and Summary
- Checkpoint Hourly Count by Alert Source
- Checkpoint Media count by Alert Source
- Checkpoint Result count by Alert Source
See also:
To build the report:
- Under Reports, select Summary, then Checkpoints.
- Select a Date Range: Alerts Received Between or Alerts Sent Between. Data is available for up to the past 13 months, but report query spans must be 31 days or less.
- Select a Reporting Domain: All or <select> Collections.
- Select Filters and Alert Types: Company and Alert Type.
- Select the Report Type: Latest Attempt or All Attempts.
- Select the Report Output Format:
- Select the Type of Data: Production Data or Test Data.
- Select Run Report.
| Report Output Format | Description |
|---|---|
| Pie Charts and Summary | Graphical representation of data distribution. See Pie Charts and Summary, below. |
| Checkpoint Hourly count by Alert Source |
Shows number of alerts that reached a specific checkpoint at different hours of the day, based
on client time zone. Use this report to gain insight about how customers interact with templates at
different times of day.
Suggested Use: Helps if you are looking for a particular response at one time of day versus another time–such as likelihood to get RPC or likelihood to interact. Hours refer to client time zone, not customer time zone. This provides insight into simultaneous activity across the country. The count does not compare, for example, how customers behave at 2:00 PM Eastern time and 2:00 PM Pacific time. For details, see Checkpoint Hourly count by Alert Source, below. |
| Checkpoint Media count by Alert Source |
Shows distribution of media types, such as voice, email, SMS and FAX, for final checkpoints. Not useful for single-channel applications, such as voice only applications. Suggested Use: Breaks out by alert source to demonstrate effectiveness of outbound versus inbound message retrieval. For details, see Checkpoint Media count by Alert Source, below. |
| Checkpoint Result count by Alert Source |
Shows result distribution, such as live answer, answering machine, busy signal, cancelled dispatches, and others, for each final checkpoint in the template. Indicates where customers exited the calls based on the type of call (result count). Also breaks out results by alert source, so it is possible to compare results by final checkpoint for outbound calls against results by checkpoint for inbound calls (that is, message retrievals). Suggested Use: Good for gaining insight as to opportunities in the template for further tuning. For details, see Checkpoint Result count by Alert Source, below. |
Here is an example Pie Charts and Summary report and table field
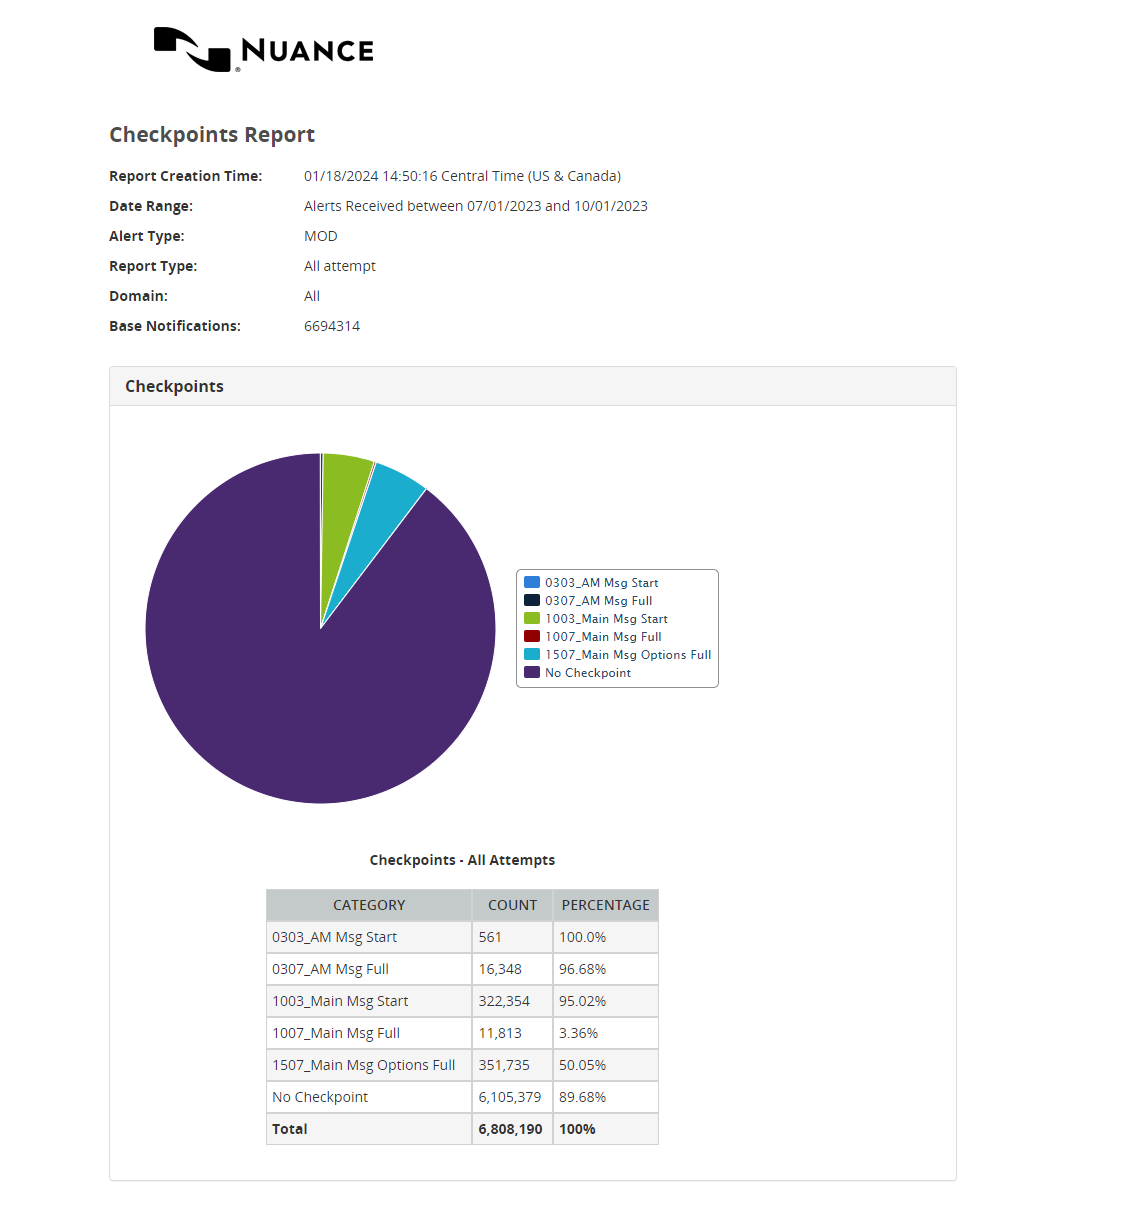
Pie Charts and Summary report fields
Here is an example Checkpoint Hourly count by Alert Source report and descriptions of table fields:
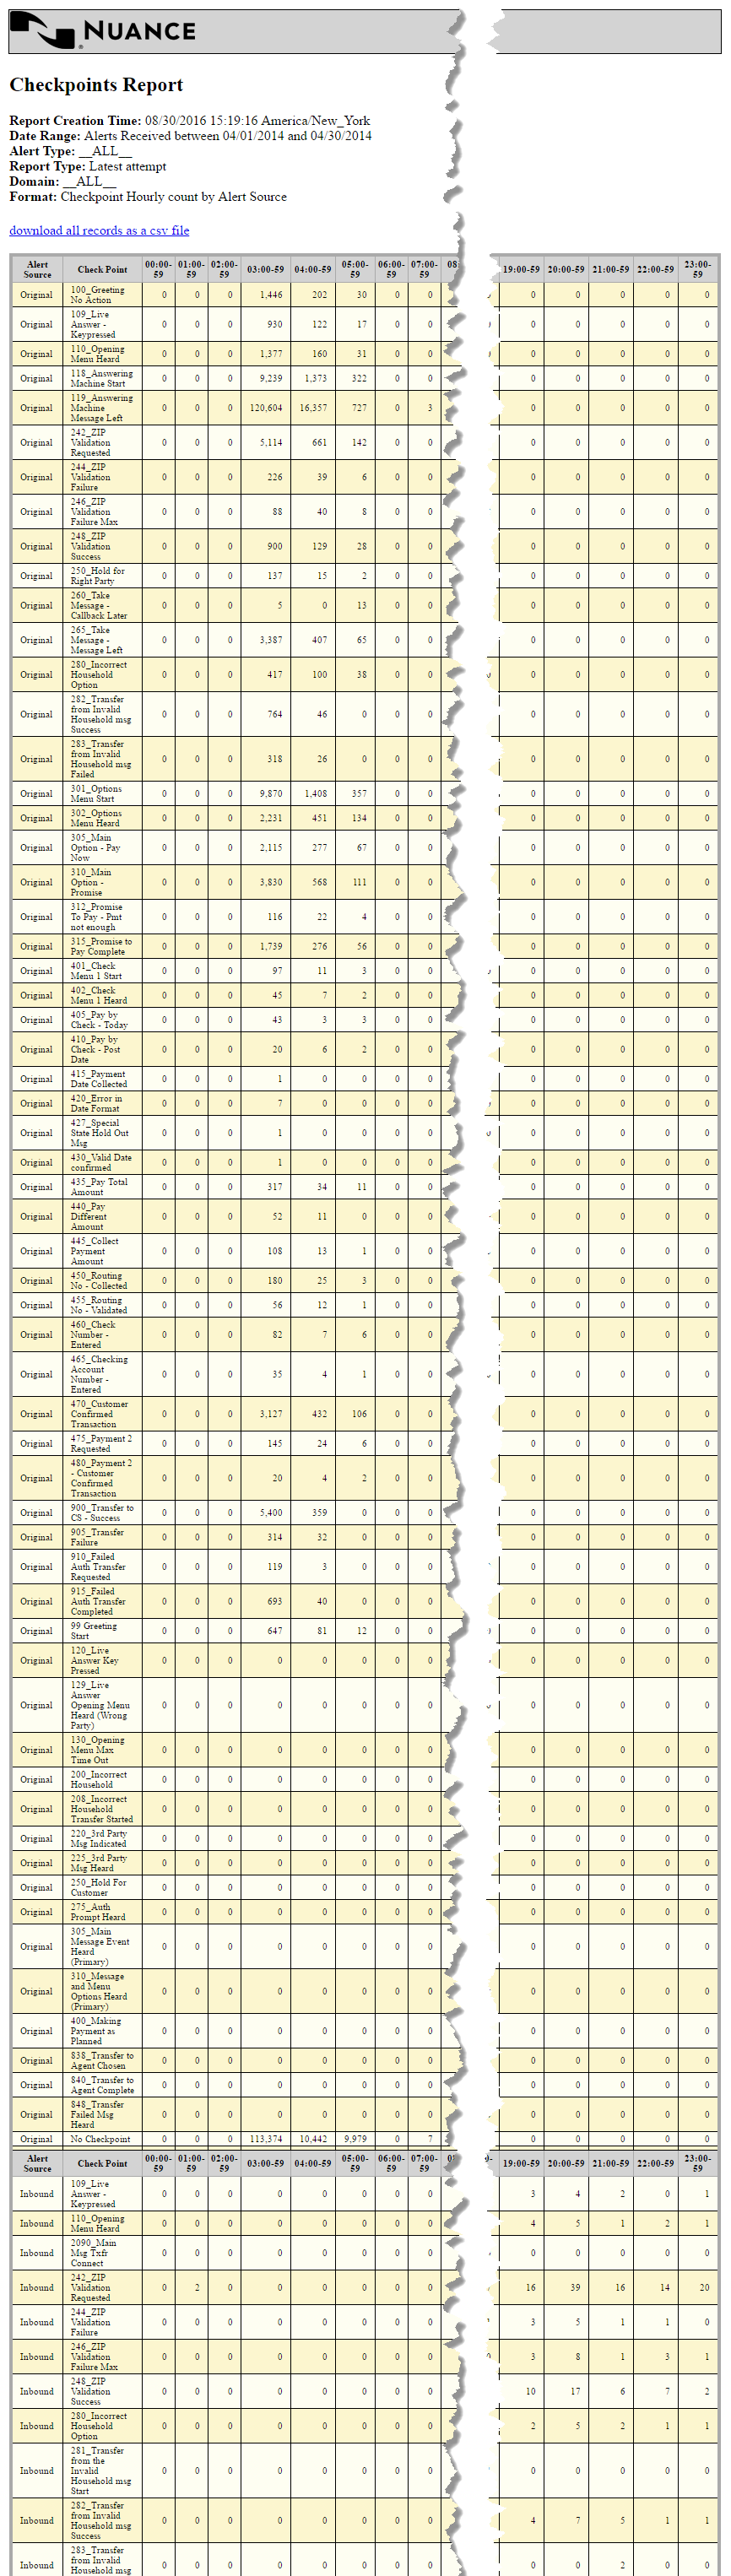
Checkpoint Hourly Count by Alert Source report
Here is an example Checkpoint Media count by Alert Source report and descriptions of table fields.
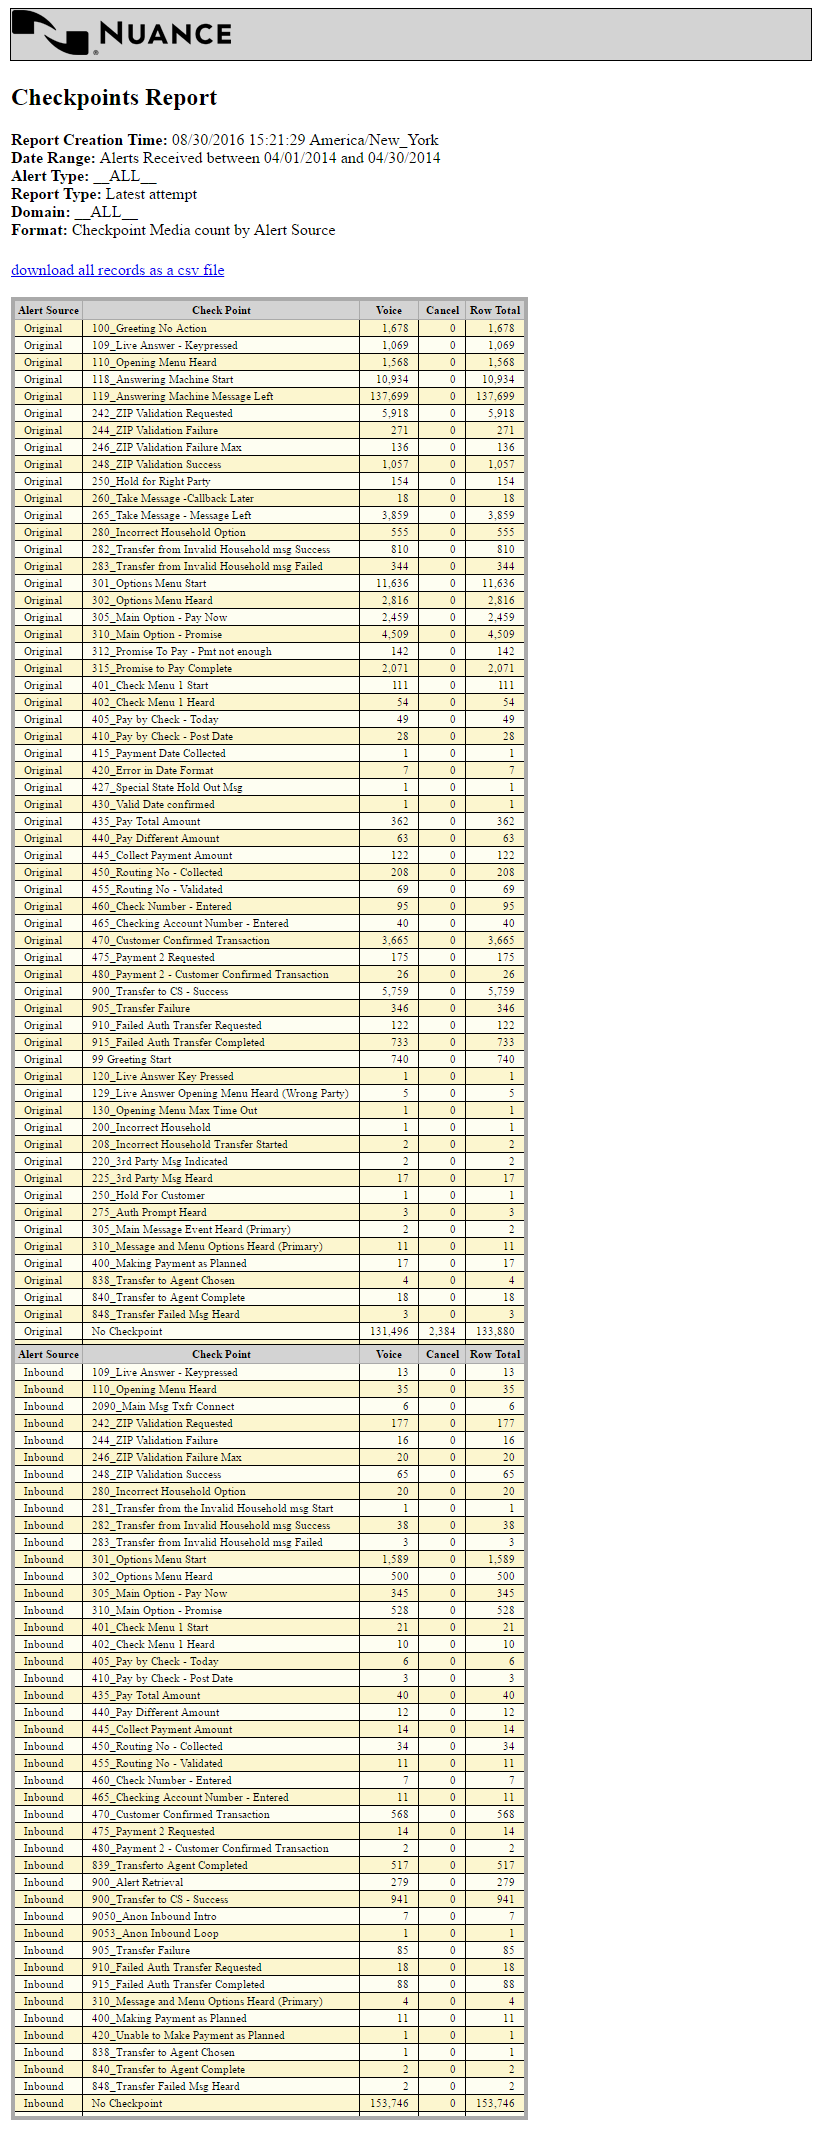
Checkpoint Media Count by Alert Source report
Here is an example Checkpoint Result count by Alert Source report and table field descriptions:
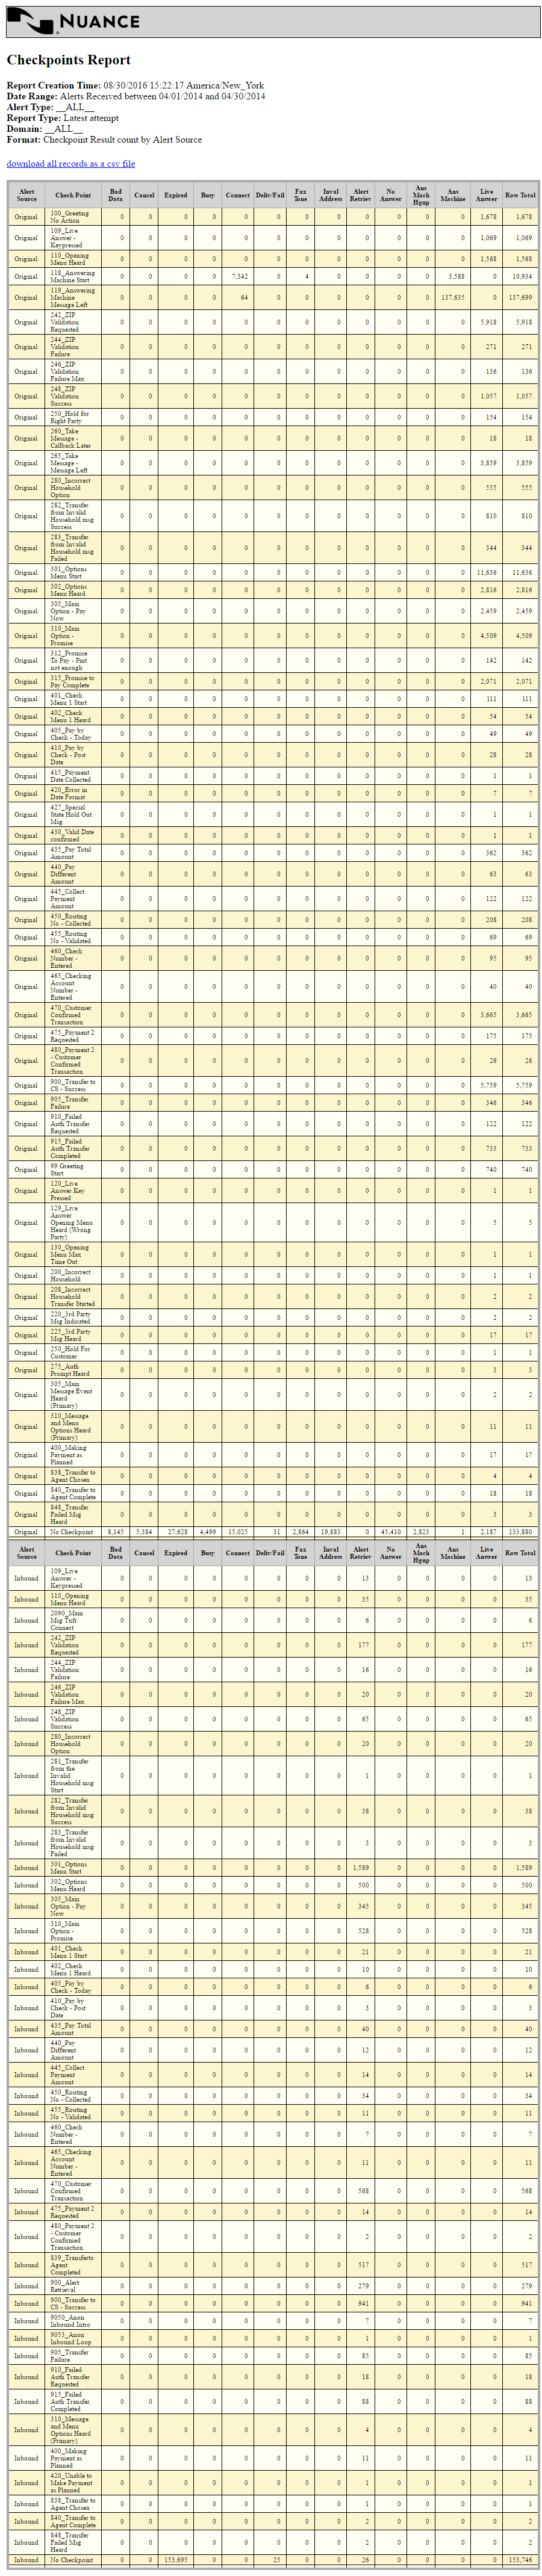
Checkpoint Result count by Alert Source report fields
