Building Interact Summary reports
Understanding interacts
Interacts are variables that are set at certain points of the message flow. They capture consumer interaction during the flow. Interact variables are specified in the solution's data map and programmed into strategic points in the template. Interacts mark the consumer's path or exit point and track specific business outcomes in a message. They differ from checkpoints in that they track specific actions taken by consumers as opposed to simply marking the path taken.
For example, an interact variable could be defined as "Language Chosen". The possible values could be "English" and "Spanish".
Understanding Interact Summary reports
Use the Interact Summary report to view interact variables at an aggregated level and distributed over time. The query offers three formats for generating interact summary reports. You can view data for alerts sent or alerts received.
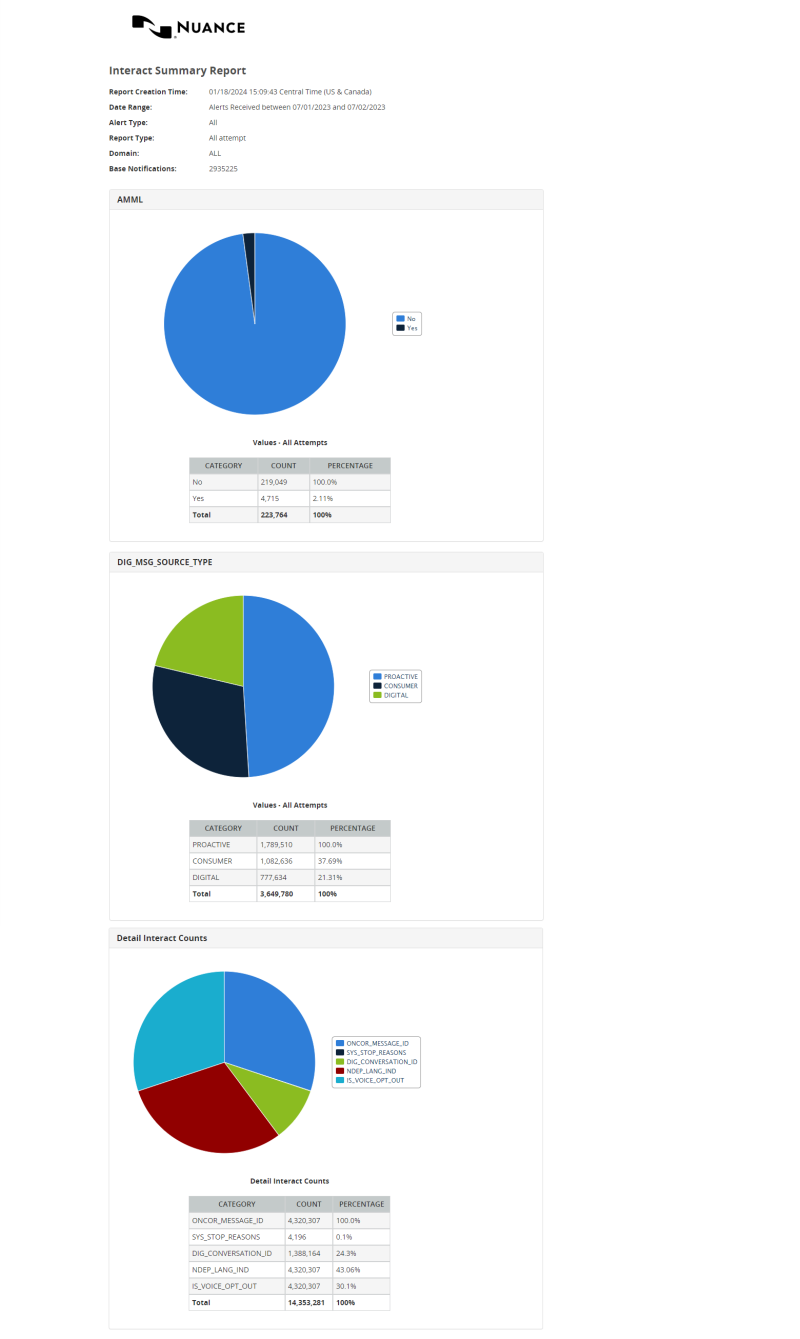
Pie Charts and Summary
This report generates a pie chart and a table for each interact variable showing the results by count and percentage.
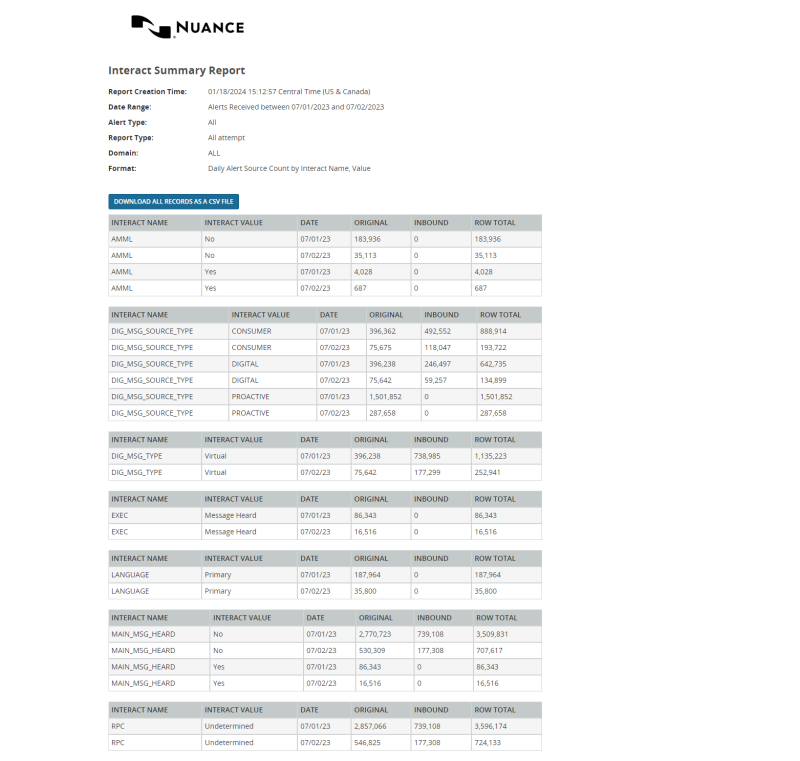
Daily Alert Source Count by Interact Name, Value
This report shows a table of interact variables by category. Each row represents an interact value and date, and shows counts for each alert source (such as Original, Reply, or Forward) and the total for all alert sources.
Example: You can generate a Daily Alert Source Count report to see which dates of a month resulted in the most successful interacts.
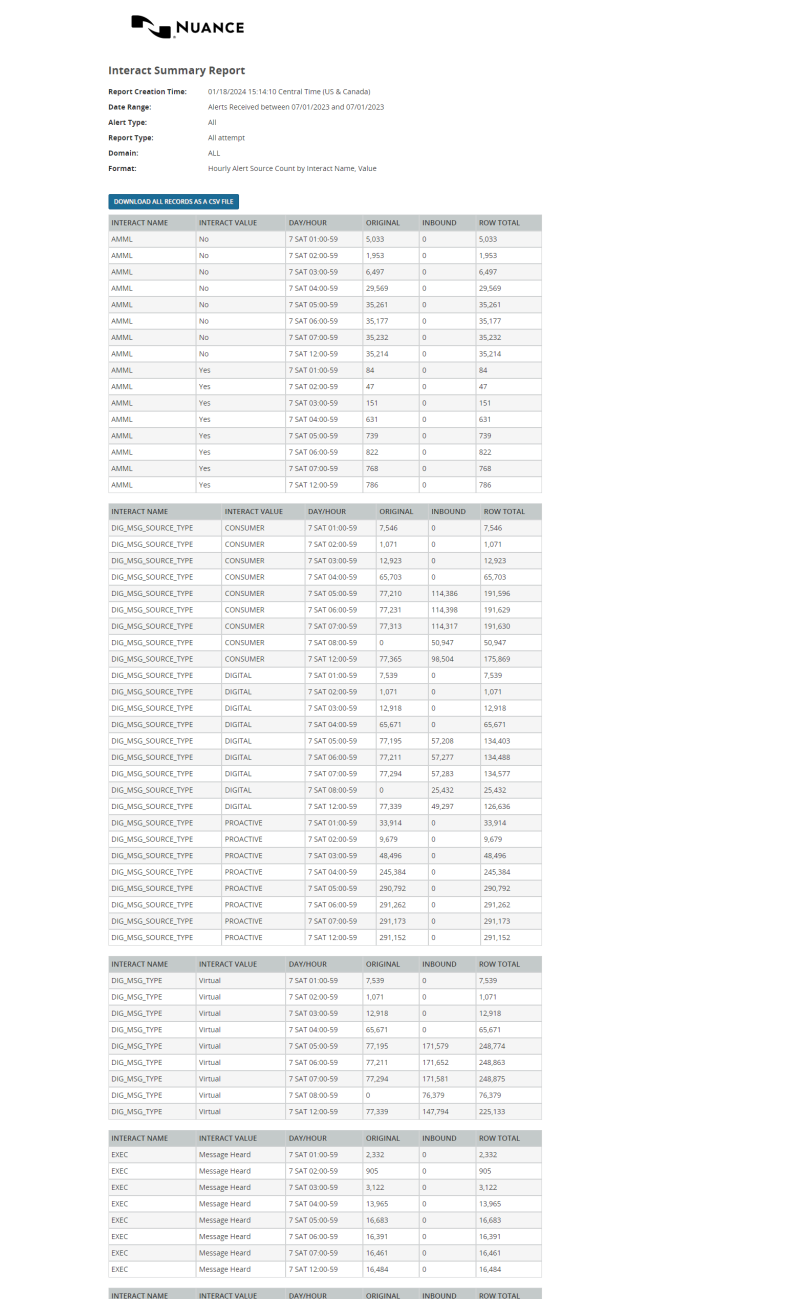
Hourly Alert Source Count by Interact Name, Value
This report shows a table of interacts by category. Each row represents an interact value and hour, and shows counts for each alert source (such as Original, Reply, or Forward) and the total for all alert sources.
Example: You can generate an Hourly Alert Source Count report to see which hours resulted in the most successful interacts.
See also:
To build the report:
- In the header, click REPORTS.
- In the left nav bar, click SUMMARY > INTERACT SUMMARY. You should see the Interact Summary query screen.
- Under Date Range, select Alerts Sent Between or Alerts Received Between.
- Enter a Date Range. Data is available for up to the past 13 months, but report query spans must be 31 days or less.
- Select a Reporting Domain. The options are defined by your application.
- Select the Alert Type to report on. Select ALL to report on all alert types. Other types are defined by your application.
- Select the Report Type. The options are Latest Attempt or All Attempts.
- Select the Report Output Format. The format options are:
- Pie Charts and Summary Daily
- Daily Alert Source Count by Interact Name, Value
- Hourly Alert Source Count by Interact Name, Value
- Select the Type of Data. The options are Production Data or Test Data.
- Click Run Report.
Here is an Example Interact Summary Report in the Pie Charts and Summary format. Only the first two charts are shown.
Here is an example of the Daily Alert Source Count by Interact Name, Value format. Note that you have the option to download all records as a CSV file.
Here is an example of the Hourly Alert Source Count by Interact Name, Value format. Note that you have the option to download all records as a CSV file.