Building Result Summary reports
Example: You generate an RSR to review the percentages of live answers, failures, and alerts sent during a given campaign window.
To build the report:
- Under Reports, select Summary, then Result Summary.
- Choose Alerts Received Between or Alerts Sent Between.
- Enter a Date Range. Data is available for up to the past 13 months, but report query spans must be 31 days or less.
- Select a Reporting Domain.
- Select an Alert Type.
- If your applications are configured to use reporting filters, make a selection under Filters and Alert Types.
- Select a Report Type: All Attempts or Latest Attempt.
- Select a Report Output Format.
- Select a Type of Data: Production Data or Test Data.
- Click Run Report.
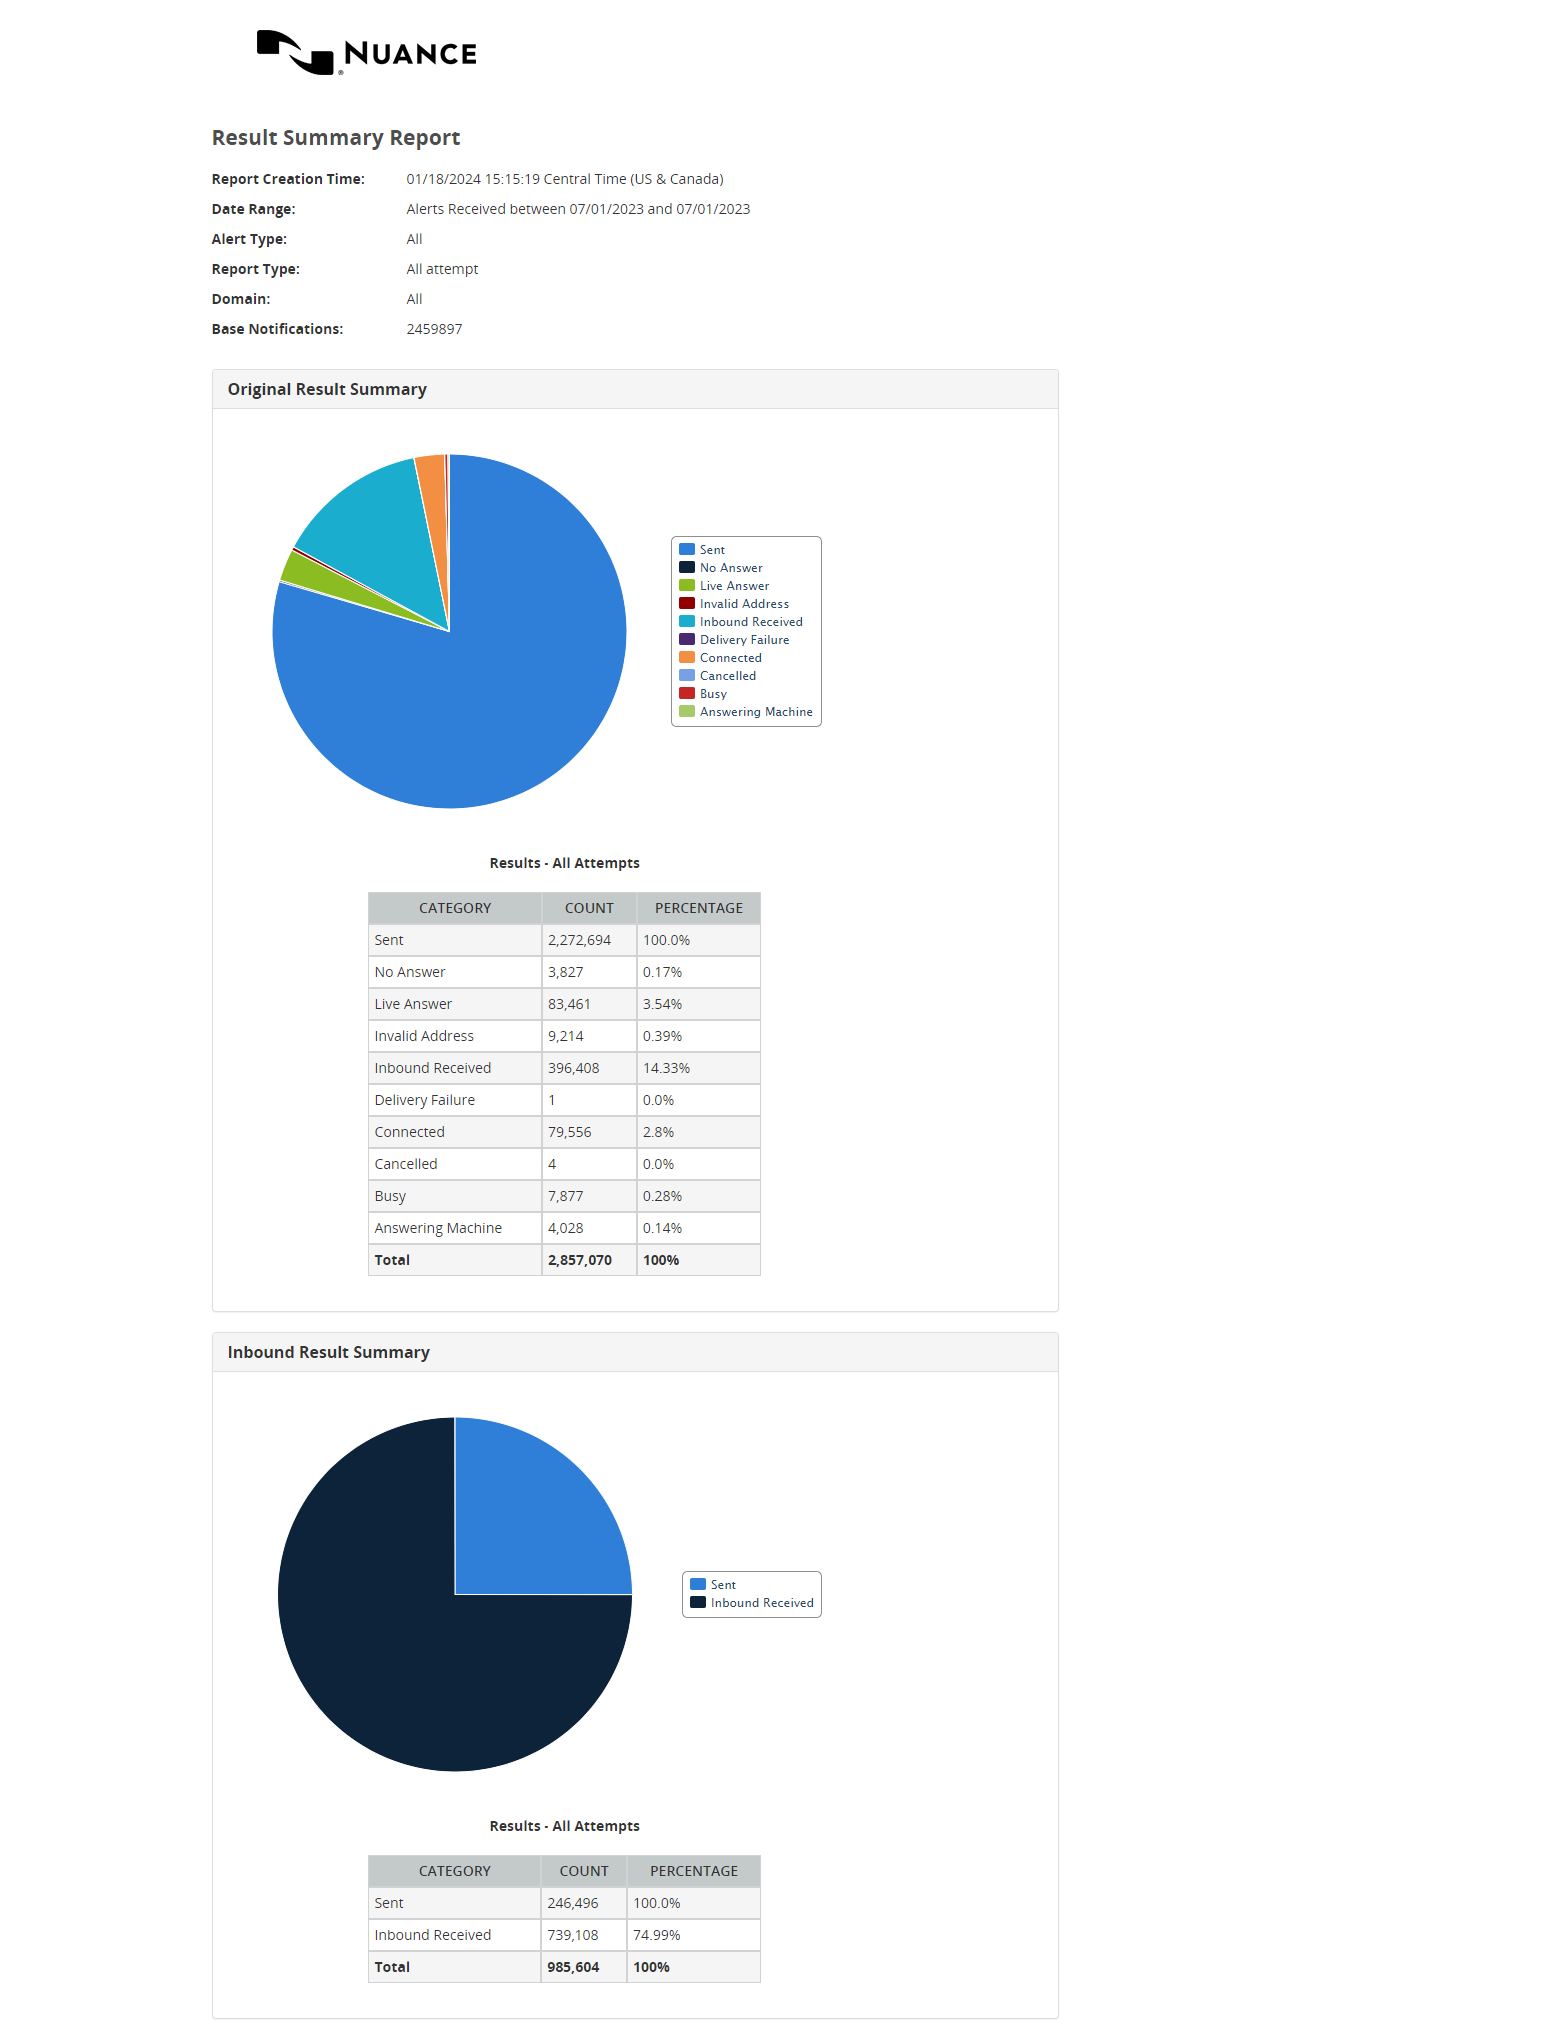
Here is an Example Result Summary Report in the Pie Charts and Summary format:
Example fields Included in an RSR
This table describes typical RSR fields:
Result categories and their corresponding result codes
|
Category |
Result code |
|---|---|
| No Answer | NA |
| Live Answer | LA |
| Invalid Address | IA |
| In Process | |
| Delivery Failure | DF |
| Connected | U |
| Busy | B |
| Bad Data | BD |
| Answering Machine | AM |
