Building Retry Analysis reports
The Retry Analysis report displays call retry information over a period of up to 30 days. Retries are counted by result type, such as Bad Data, Busy, and Live Answer. The report generates a series of tables, one table for each result code that was detected. The table will have one row for every attempt that was recorded. In addition, a graph allows you to compare the counts for all result code.
See also:
To build the report:
- In the header, click REPORTS.
- In the left nav bar, click ANALYSIS > RETRIES. You should see the Retry Analysis query screen.
- Under Date Range, select Alerts Sent Between or Alerts Received Between.
- Enter a Date Range. Data is available for up to the past 13 months, but report query spans must be 31 days or less.
- Select a Reporting Domain. Select ALL to report on all domains, or select a single domain. The domains are defined by your application.
- Select the Alert Type to report on. Select ALL to report on all alert types, or select a single alert type. The types are defined by your application.
- Select the Type of Data. The options are Production Data or Test Data.
- Click Run Report.
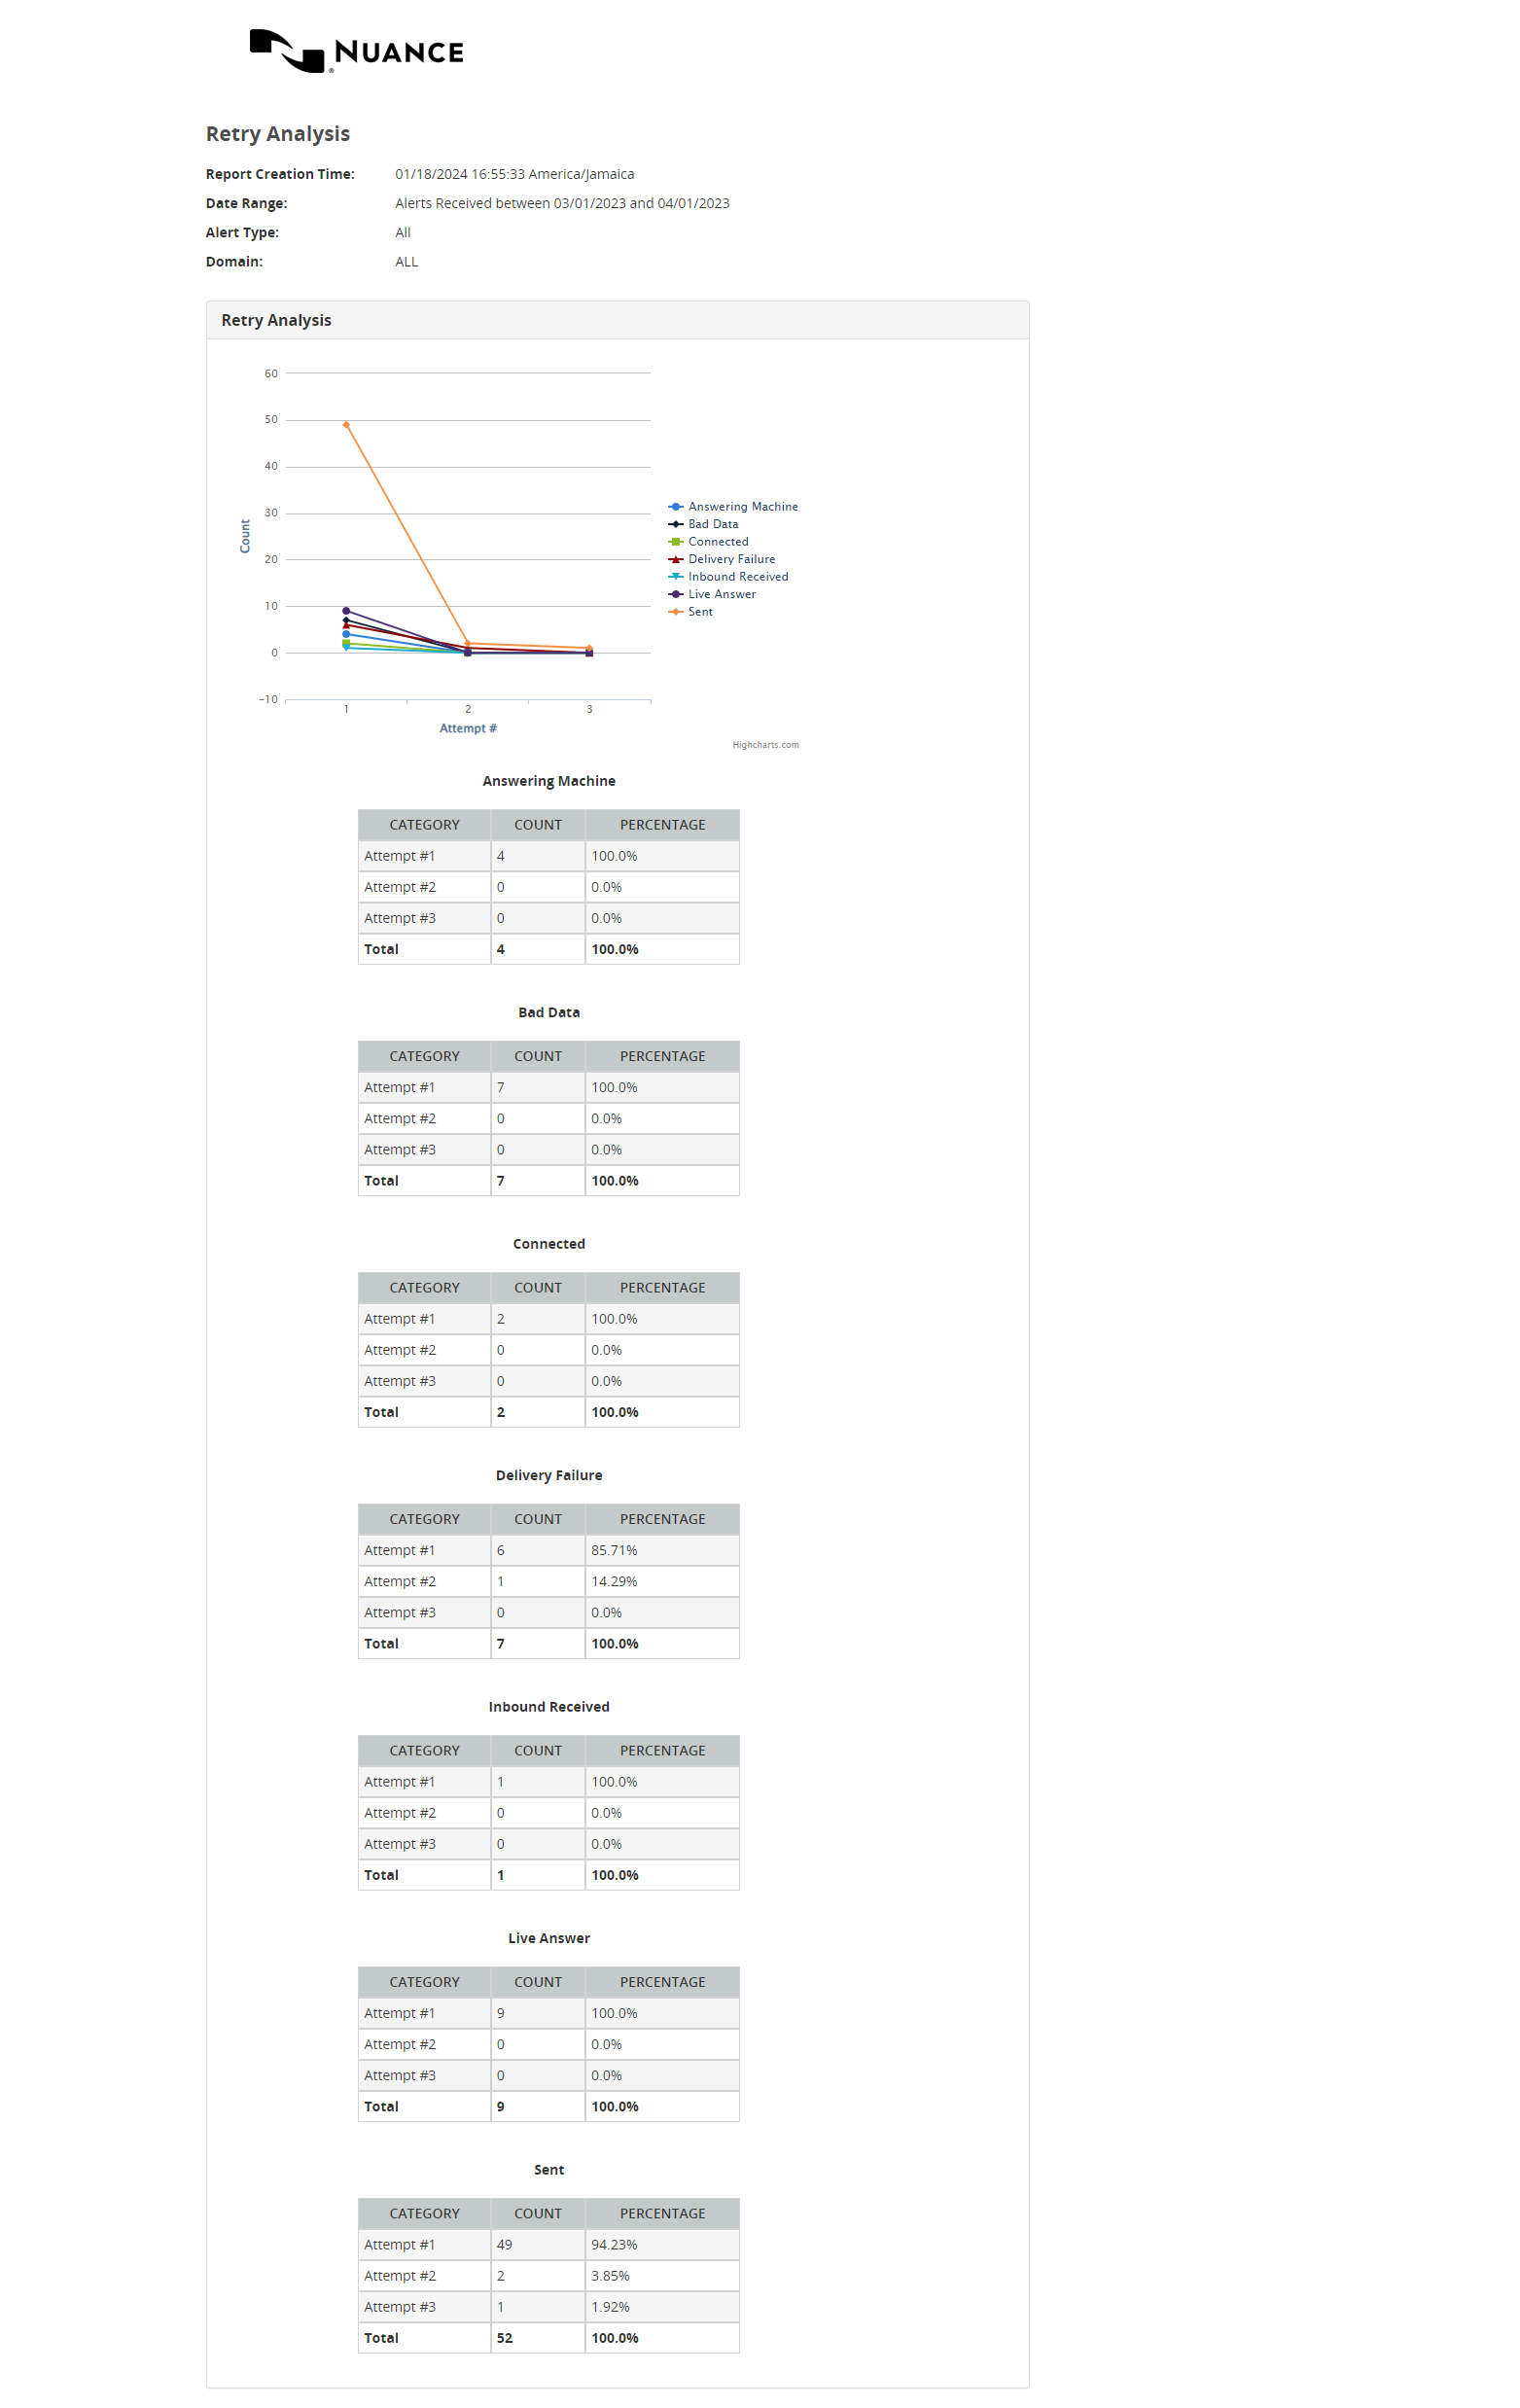
Below is an extract from a sample Retry Analysis report. During this period 12 different result codes were recorded. To save space, we have included only the first two result tables in this image. The result tables have three columns: Attempt #, Count, and Percentage. By far, the most common result code was Answering Machine Hangup.