User interface overview
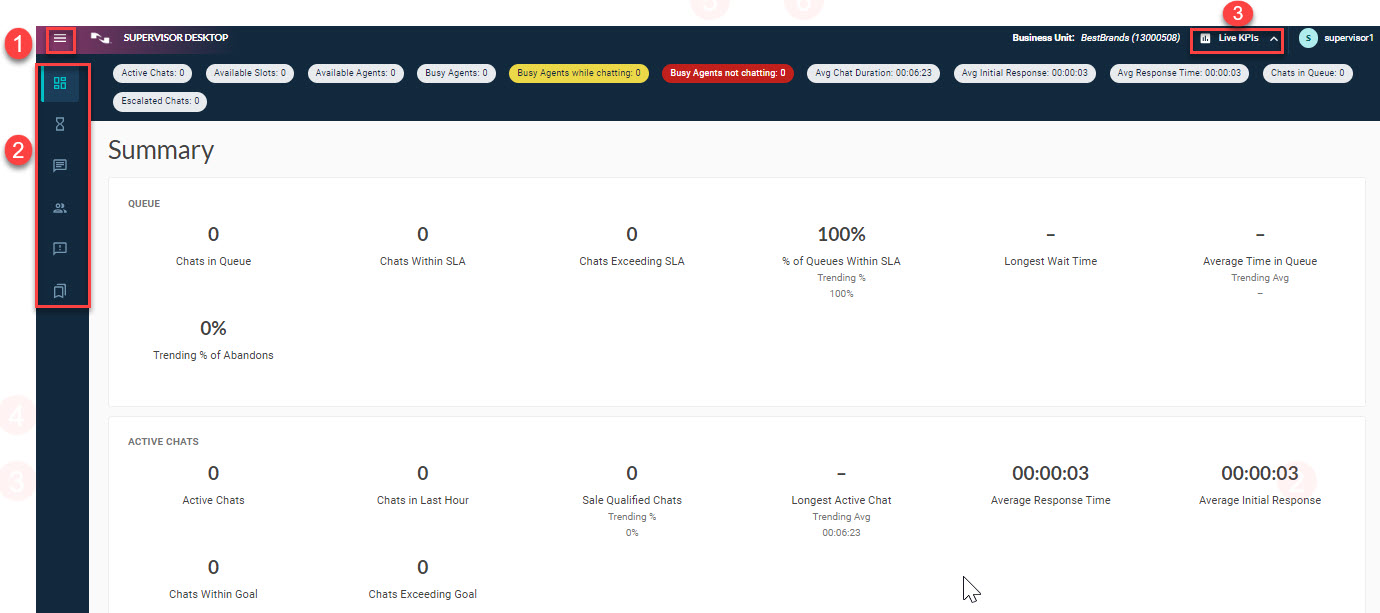
Upon logging in, you'll see the default page with the Summary tab selected. This gives you an overview of the current status of the queue, chats in progress, and agents who are logged in. On this page, you'll see the following elements:
-
Click the Navigation button (1), located at the top left, to collapse or expand the left navigation bar as needed. For details, see Navigation menu.
-
Click a Data tab (2) to display data in the center panel. For details, see Data tabs. The following Data tabs are available:
-
Summary tab, described in Summary tab
-
Queue tab, described in Queue tab
-
Active tab, described in Active tab
-
Agents tab, described in Agents tab
-
Follow Up tab, described in Follow Up tab
-
Bookmarks tab, described in Bookmarks tab
The Summary tab is selected by default.
-
-
Click the Live KPIs button (3) to display or hide the key performance metrics, such as active chats and available agents. For details, see Live KPIs.
-
The center panel (4) displays live metrics based on the data tab selected in the left navigation.